


The economic and geopolitical failings of Trump’s tariffs
Trump tariffs will raise U.S. prices by 5.4% and lower real income by 0.8%. They hurt close U.S. allies much more than the Chinese economy.


Tariffs from the Trump Administration have been justified on economic and geopolitical grounds. I show through general equilibrium trade modeling that the Trump tariffs implemented to date will hurt the U.S. economy by raising aggregate U.S. prices by 5.4% and lowering real income by 0.8%. They also misfire geopolitically. The tariffs are expected to lower real income in Mexico by 0.9% and in Canada by 0.6%, due to their strong dependence on U.S. exports. Surprisingly, despite the 145% tariffs imposed on imported Chinese goods, modeling shows China’s real income is expected to fall by only 0.3% in part because only 1% of total Chinese output is exported to the U.S.
Introduction
The first hundred days of the Trump Administration have seen a constant whiplash of new import tariffs, with daily, and in some cases hourly policy changes. Tariffs have been applied to specific sectors, to specific countries, and across the globe, in some cases in a maximalist manner. While there has been a recent pause in these developments, uncertainty remains high on which tariffs will stick, which new ones will be introduced, and how foreign countries will retaliate.
Let’s start with taking stock on which new ad-valorem (i.e., applied to the price of imports) tariffs have been introduced since the start of the Trump Administration. The first set are 25% sectoral tariffs applied to all imports (regardless of origin) of iron, steel, aluminum, automobiles and automobile parts. The second set of tariffs are applied globally across all products and all origins at 10%. Notably, this excludes Chinese imports, which now face an additional 145% tariff, with some exemptions placed on electronics. In response, China has introduced 84% retaliatory tariffs on U.S. goods and an export ban on several critical minerals and magnets.1
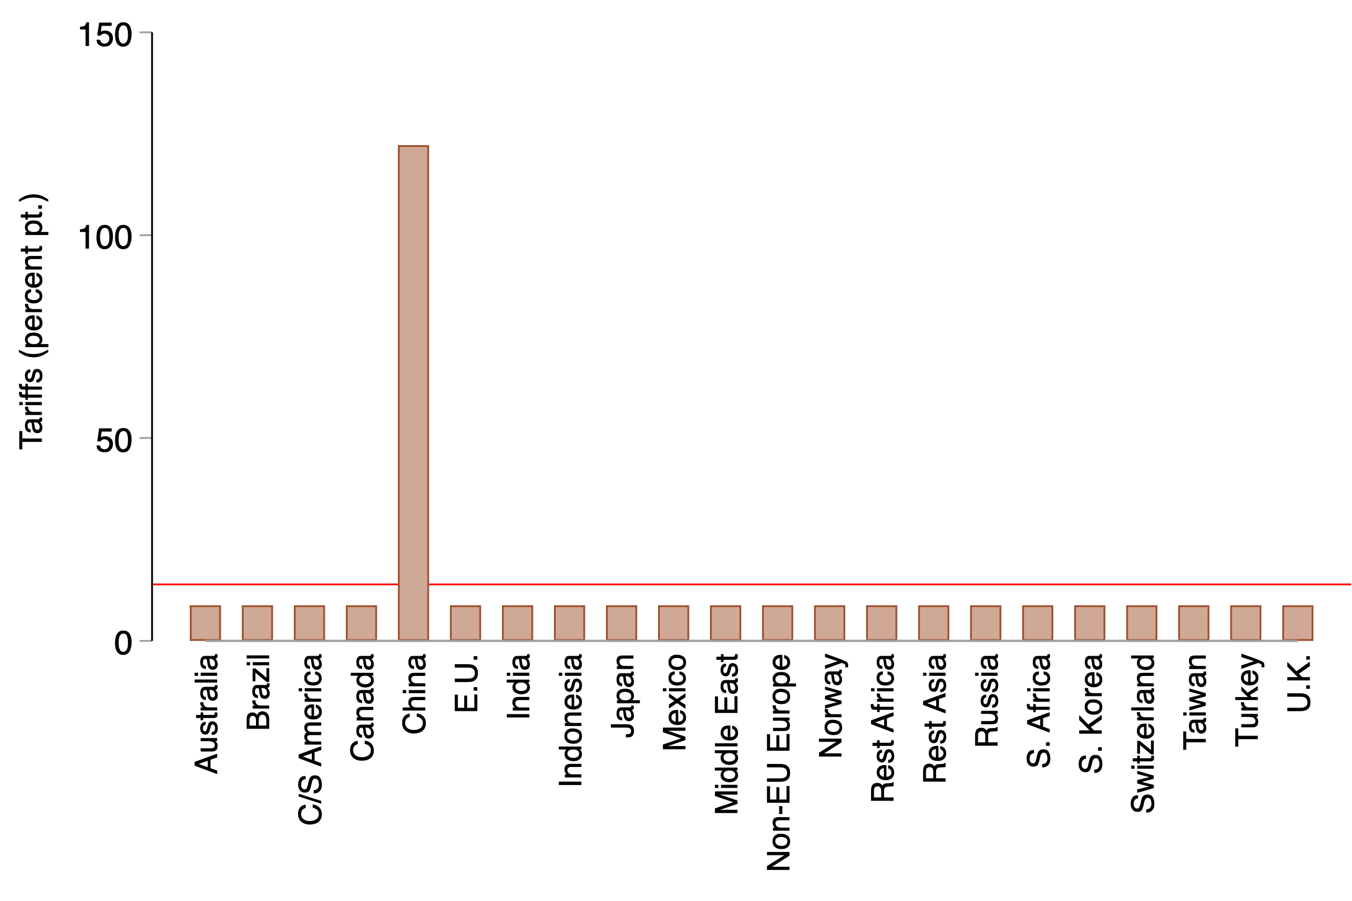
Altogether, the last 100 days has seen a nearly six-fold increase in U.S. import tariffs to 14% on average. Prior to the Trump administration, the average U.S. import tariffs in 2024 was 2.5%. Figure 1 shows where average U.S. import tariffs stand today by country or region of origin.
Figure 1: Average U.S. import tariff have increased by almost 6 times since the start of the Trump Administration
Average new ad-valorem tariff by country/region of origin under Trump tariffs during the first one hundred days.
Several additional tariffs may still be implemented. This includes tariffs that may apply to imports from Mexico and Canada not covered under the U.S. Mexico Canada Agreement (USMCA), depending on how that eligibility is interpreted, and potential tariffs that are currently being investigated by the Department of Commerce on timber and copper imports and on Southeast Asian solar panels under antidumping and countervailing duties.
U.S. import dependence in targeted sectors and on Chinese goods
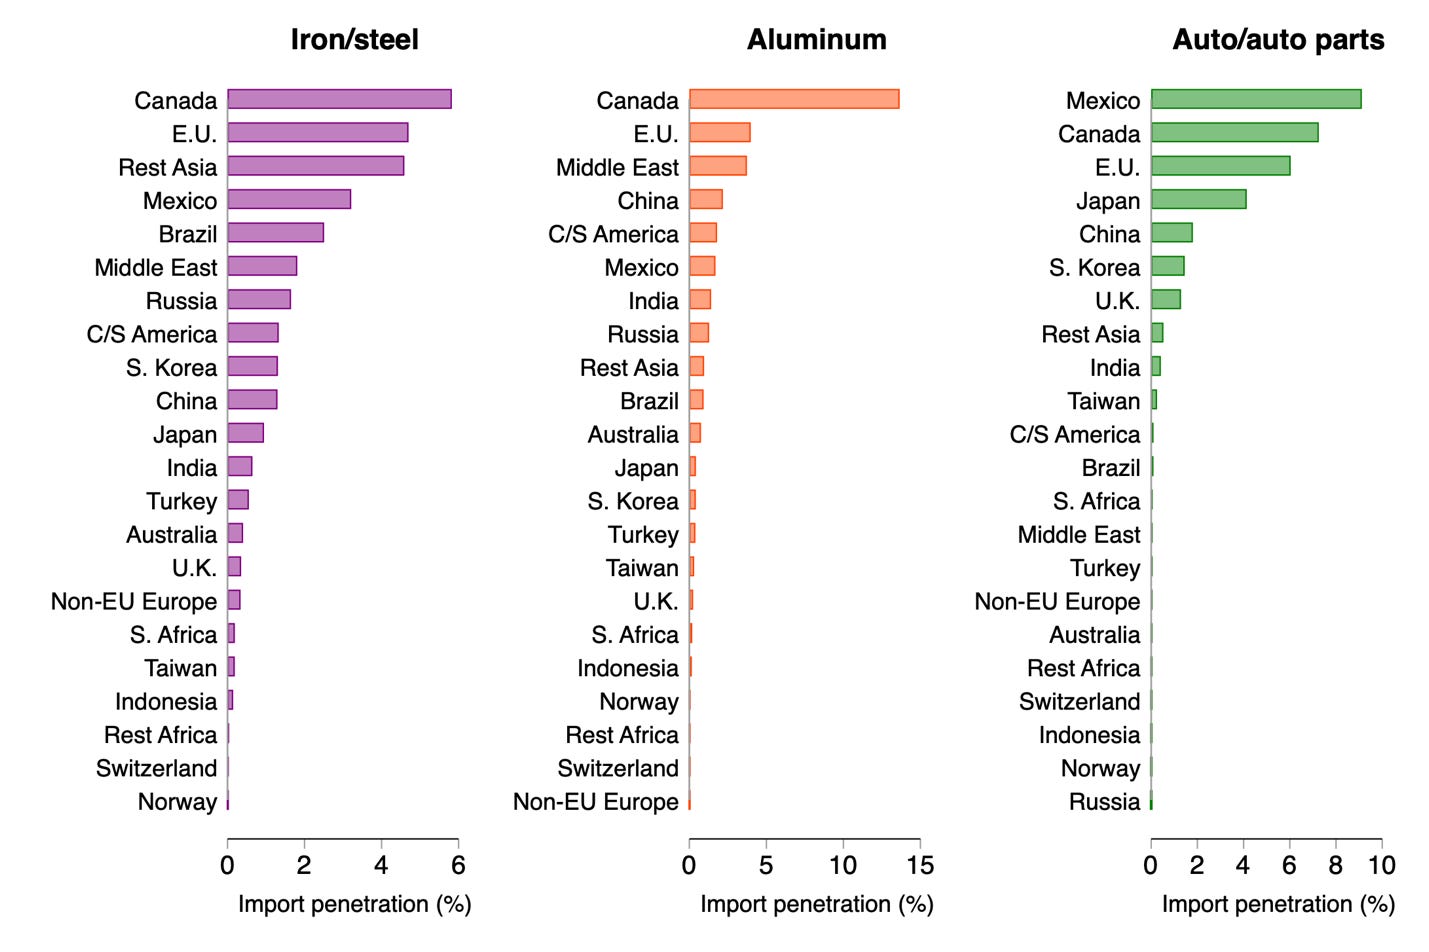
To understand how tariffs introduced thus far may impact the U.S. economy, it helps to first look at how dependent the U.S. economy is on imports, both across partners for targeted sectors and across sectors for Chinese goods. Figure 2 shows import penetration – the share of U.S. consumption in that sector met by imports from a trading partner – for targeted sectors in 2022. Imports from Canada, Mexico and the E.U. dominate U.S. imports of iron/steel, aluminum, and automobile/automobile parts.
Figure 2: U.S. iron/steel, aluminum, and auto/auto parts imports imports primarily come from Canada, E.U., and Mexico
U.S. import penetration share for iron/steel, aluminum, and automobile/automobile parts across trading partners
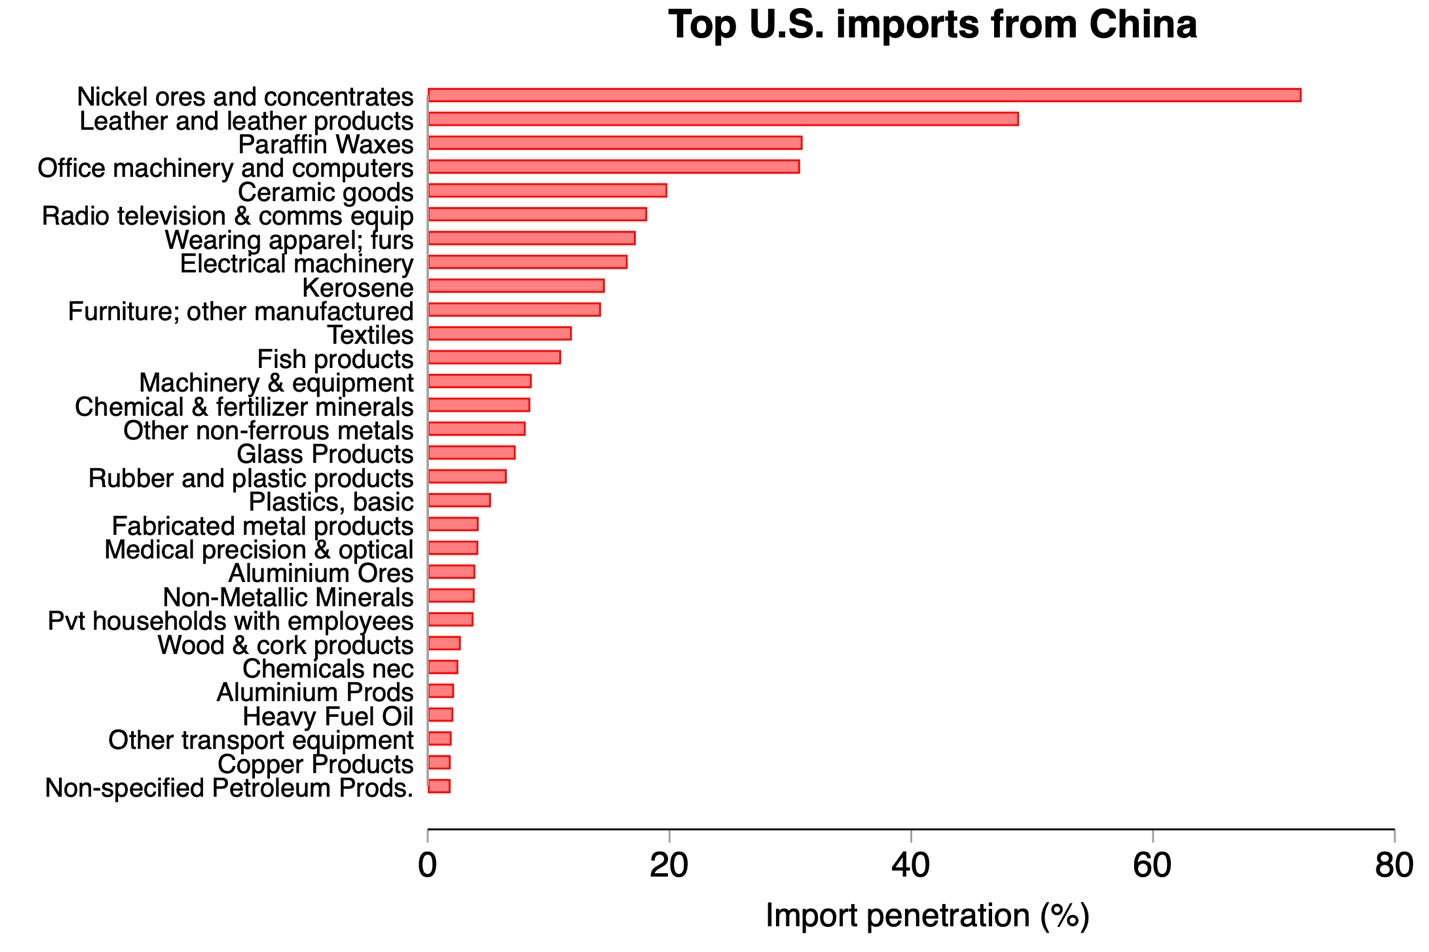
Interestingly, the U.S. economy is not particularly dependent on Chinese imports in these targeted sectors, in part because existing tariffs on Chinese imports are already relatively high. Instead, Chinese imports play a bigger role in other sectors, as shown in Figure 3 depicting the sectors for which Chinese imports provide more than 10% of U.S. consumption. While there are some finished goods on this list, many products with high Chinese import dependence are intermediate goods used by U.S. industries such as minerals and metals, textiles, plastics, and electronic machinery and equipment, implying that tariffs on these imports would raise the cost of final goods produced in the U.S.
Figure 3: U.S. is dependent on Chinese exports for many intermediate goods
Sectors with the highest U.S. import penetration from China
Modeling the Trump tariffs
I use a quantitative general equilibrium trade model to analyze the impact of the Trump tariffs on bilateral trade flows, outputs, prices, and wages. Specifically, I deploy a multi-sector Armington model using data from Exiobase3, a global trade database with bilateral trade flows, production and consumption for 200 sectors. I model the Trump tariffs that have been announced to date: 10% global tariffs, 145% Chinese tariffs, 25% sectoral tariffs, and 84% Chinese retaliatory tariffs (see details in the methods section). The model allows prices to fully adjust to the tariffs, which can be viewed as longer term results if prices in practice take time to respond.
Figure 4 shows the modeled percent change in U.S. imports by trading partner due to these tariffs. Across trading partners, the average U.S. import falls by 9.3%, with imports falling by 80% from China. Falling imports are met by increased U.S. domestic production, but also with higher U.S. consumer prices. The left panel of Figure 5 shows the 30 sectors with the largest modeled increase in U.S. output due to the tariffs, while the right panel shows the 30 sectors with the highest modeled increase in U.S. consumer prices. There are many sectors with price increases exceeding 10%, many of which contain intermediate goods that will make U.S. final goods production more costly.
Figure 4: Trump tariffs have large large impacts on U.S. imports from many trading partners
Modeled percent change in U.S. imports by partner under Trump tariffs during the first one hundred days
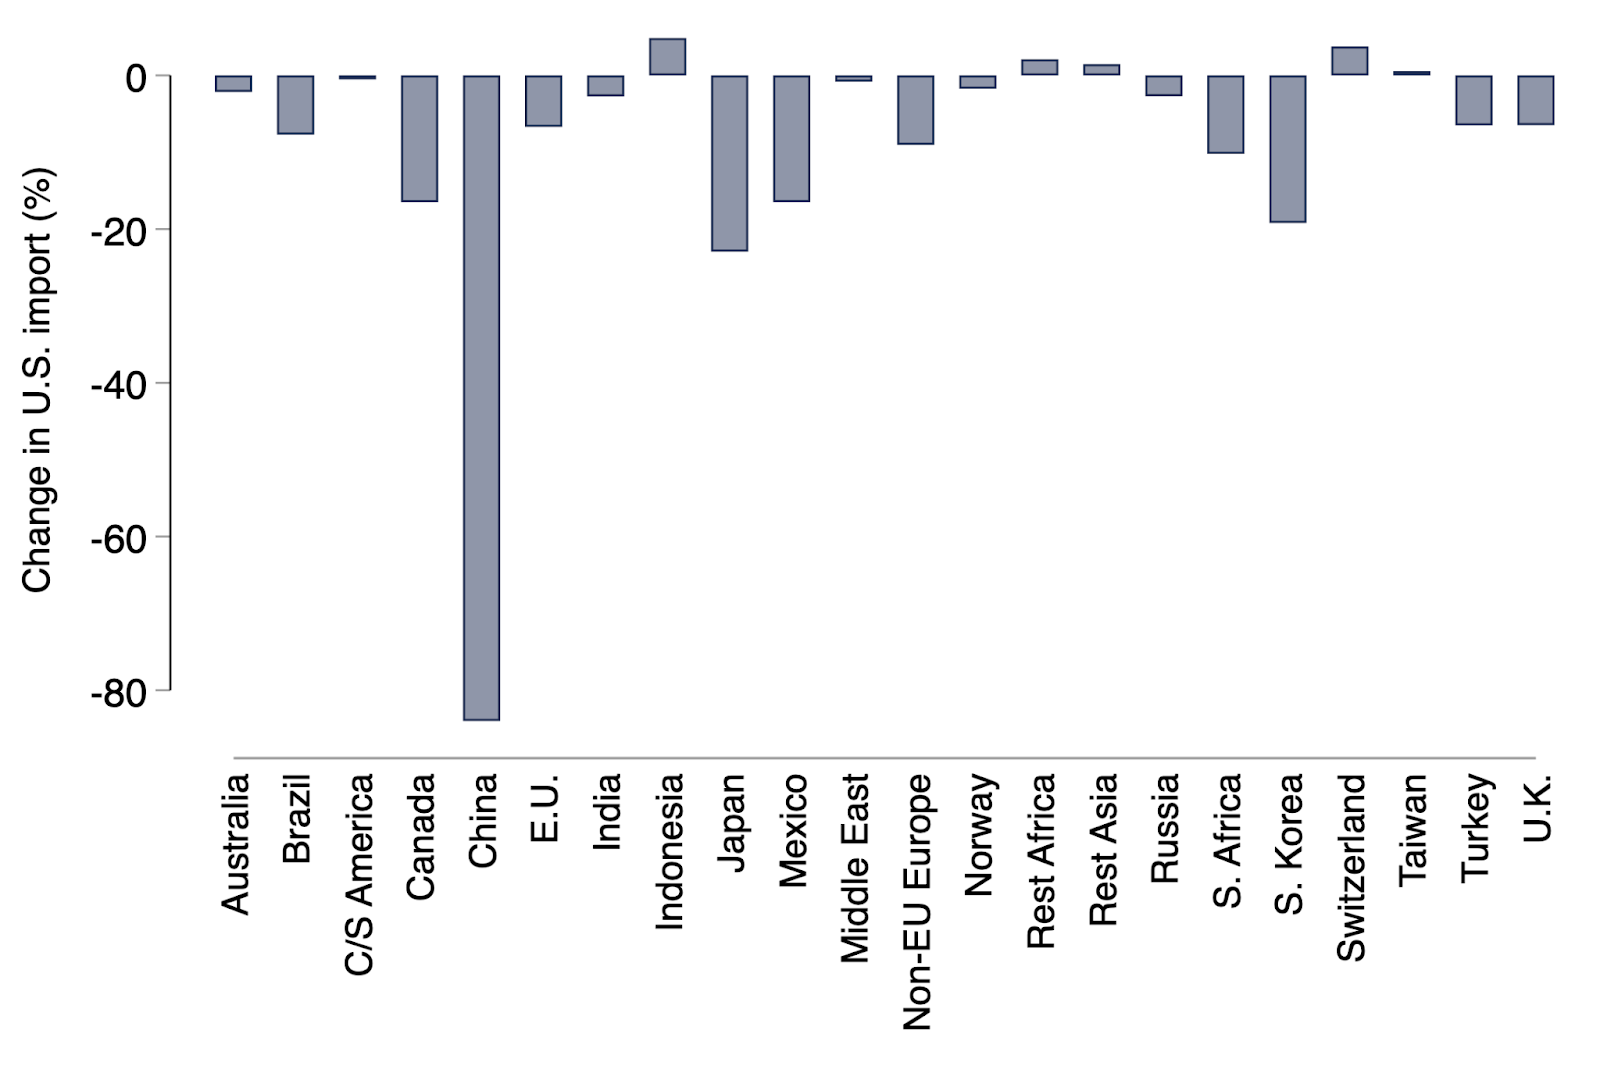
Figure 5: Trump tariffs have large impacts on U.S. output and prices
Modeled percent change in U.S. output and consumer price for top sectors under Trump tariffs during the first one hundred days
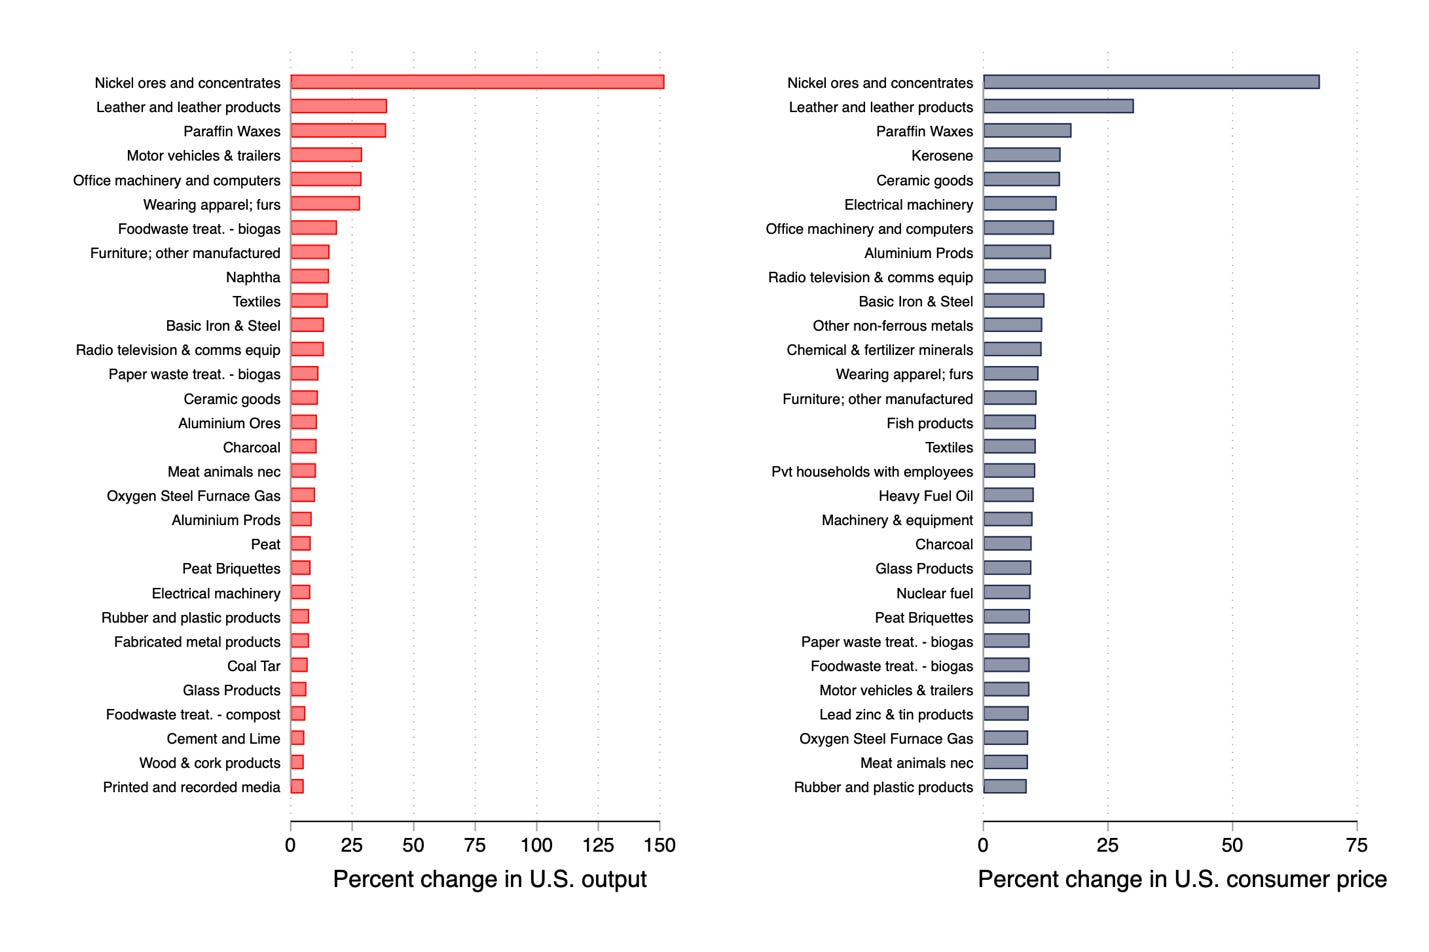
While increased U.S. output of these traded goods lead to higher wages, such increases are not enough to offset higher consumer prices. Across all sectors, aggregate U.S. prices rise by 5.4%, while real income falls by 0.8%. Altogether, the tariffs would raise $333 billion in annual gross revenue. If one were to adjust for an assumed 10 percent noncompliance rate and a 24 percent income and tax offset as estimated by the Congressional Budget Office, the net annual tariff revenue would be $220 billion.
Impacts on other countries
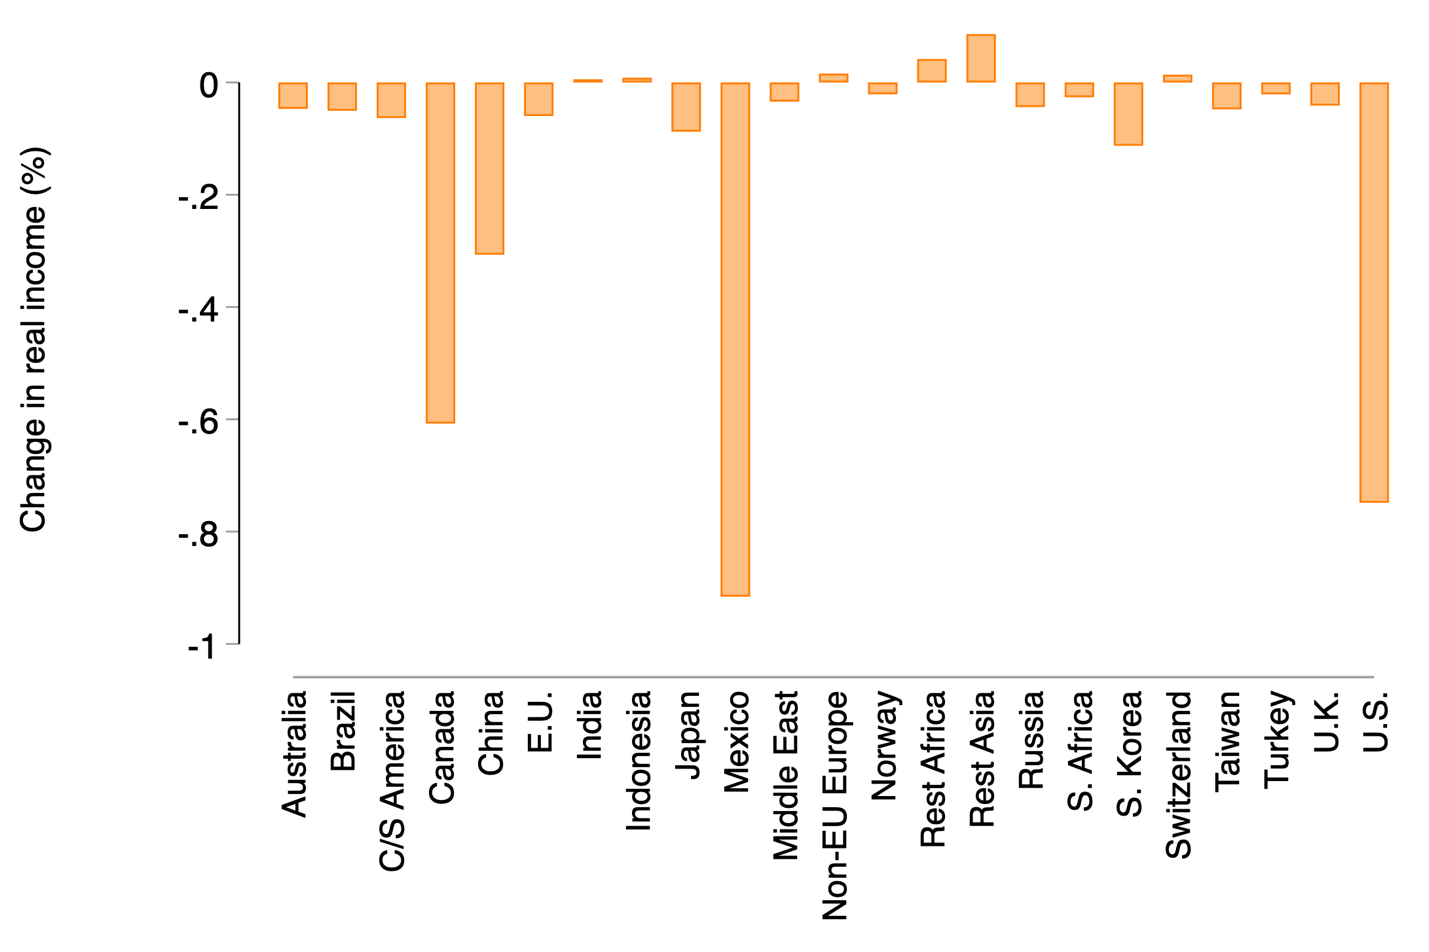
Finally, I turn to what would happen to other countries. Figure 6 shows the modeled change in real income for each country under the Trump tariffs. Despite the 145% U.S. tariffs applied to Chinese imports, the impact on Chinese real income is only -0.3%. By contrast, Mexico experiences the largest drop in real income of -0.9% followed by Canada with -0.6%. This is because China exports little to the U.S. relative to its production: in 2022 only 1% of total Chinese output is exported to the U.S. This small export share dampens the impact of U.S. tariffs, even at 145%, on the Chinese economy. By contrast, 15% and 11% of total output in Mexico and Canada is exported to the U.S., leaving those economies much more vulnerable to U.S. import tariffs.
Figure 6: Trump tariffs have large impacts on real incomes in U.S., Mexico, and Canada, but not in China
Modeled percent change in country/region real income under Trump tariffs during the first one hundred days
Conclusion
Well-designed import tariffs can be used to meet different (though possibly competing) objectives. They can boost domestic production of strategically important sectors and economically contain geopolitical rivals. However, trade modeling shows that the Trump tariffs to date will likely fail in these objectives. The tariffs boost domestic production and U.S. prices for many intermediate goods, making final U.S. goods more costly to produce, all while reducing U.S. real income by 0.8%. And have relatively small impact on Chinese output, while leading to much larger economic contraction in Mexico and Canada. A more effective trade strategy would involve a targeted set of tariffs that meet clear national security and economic goals, such as maintaining U.S. competitiveness in technologically-advanced sectors, while promoting economic integration with U.S. allies in a manner that further these goals.
Methods
I use a multisector Armington model with linear production, fixed sectoral expenditure shares, and no tax revenue recycling. The model is calibrated using Exiobase3 (Stadler et al., 2018), a multi-region input-output database with 200 sectors built, in part, on bilateral trade data from Comtrade. I calibrate the model using sector-specific Armington trade elasticities estimated by Ossa (2015).
I jointly model the following components of the Trump administration’s new ad-valorem import tariffs to date: (1) 10% country-level tariffs on all goods from all trade partners, (2) 145% tariffs on all goods from China in lieu of (1), (3) sector-level 25 percent tariffs on iron/steel, aluminum, and automobile/automobile parts from all countries in addition to (1) and (2), and (4) sector-level exemptions for copper and timber/lumber, and (4) 84% retaliatory tariffs from China on all imports from the U.S.
More background on Trump Administration tariffs can be found in this commentary I wrote with CSIS colleagues.
 | A guest post by
|
Nice post. I was hoping someone had a "shovel-ready" model for this issue.
A question about time. Is this essentially a simultaneous change model? You mention that some of these effects can be taken as longer term results "if prices take time to respond". Well, they do, obviously. And the responses to prices take time, too. And that means downstream economic events and other countries' responses will feed back into the changes from the tariffs. Any thought as to how sensitive your predictions will be to all this?