


Population adjustments will cause the next jobs report to be misinterpreted and misconstrued
The recent surge in immigration made the household survey especially hard to interpret, but if historical data were revised, we’d see that the labor force has grown smoothly and steadily


This Friday’s jobs report for January 2025 will include extraordinarily big increases to population, the labor force, and employment in the household survey. These increases align with the latest Census population estimates, which were revised upward after previously underestimating immigration. However, these population adjustments to the household survey will confuse even close watchers of jobs data and will likely be misconstrued.
Here’s what to know:
The employment level and the labor force in the household survey are likely to be almost 2 million higher in January 2025 than in December 2024, in addition to whatever real changes happened in the labor market during that month. Plus, the labor force participation rate is likely to be one-tenth of a point higher due to the population adjustment. But the unemployment rate and the prime-age employment-population ratio will be only minimally affected.
The increase in reported employment will be concentrated among native-born workers, not foreign-born workers, even though the new higher Census population estimates are due almost entirely to immigration. This is because immigration affects the household-survey population adjustment indirectly, through its impact on the age, racial/ethnic, and sex composition of the population. For this reason, changes in the levels of native- and foreign-born employment should be ignored; focus on headline ratios and rates instead.
Historical data in the household survey are not revised and therefore can’t be compared over time. But if the historical data were revised to align with the latest population estimates, it would show that the CPS population estimates have been low for several years, even before the immigration surge. It turns out that the labor force has grown at almost exactly the same average rate as officially reported by the household survey since 2020, but more smoothly.
The payroll survey benchmark revision, which is also part of the January 2025 jobs report, will be much more straightforward than the household survey population adjustment. Payroll survey data – unlike household survey data – are revised historically and are designed to show trends over time. The payroll survey is likely to be revised significantly downward. Combined with the upward adjustment to employment in the household survey, the two surveys will come much more into alignment than they have been recently.
The CPS population adjustment will add millions to employment but will only minimally affect the unemployment rate and prime-age ratios
Each year, as part of the January jobs report released in early February, the Bureau of Labor Statistics (BLS) adjusts the Current Population Survey (CPS, also known as the household survey) to align with the latest official population estimates produced by the Census Bureau. If you look at the total adult population published in the monthly jobs report, or calculate it from appropriately weighted CPS microdata, it will equal the Census population estimate for that month. The Census introduces new population estimates annually, so the total population reported in the CPS shifts up or down each year to align with the latest annual estimates and then grows smoothly for the rest of the year (see chart).
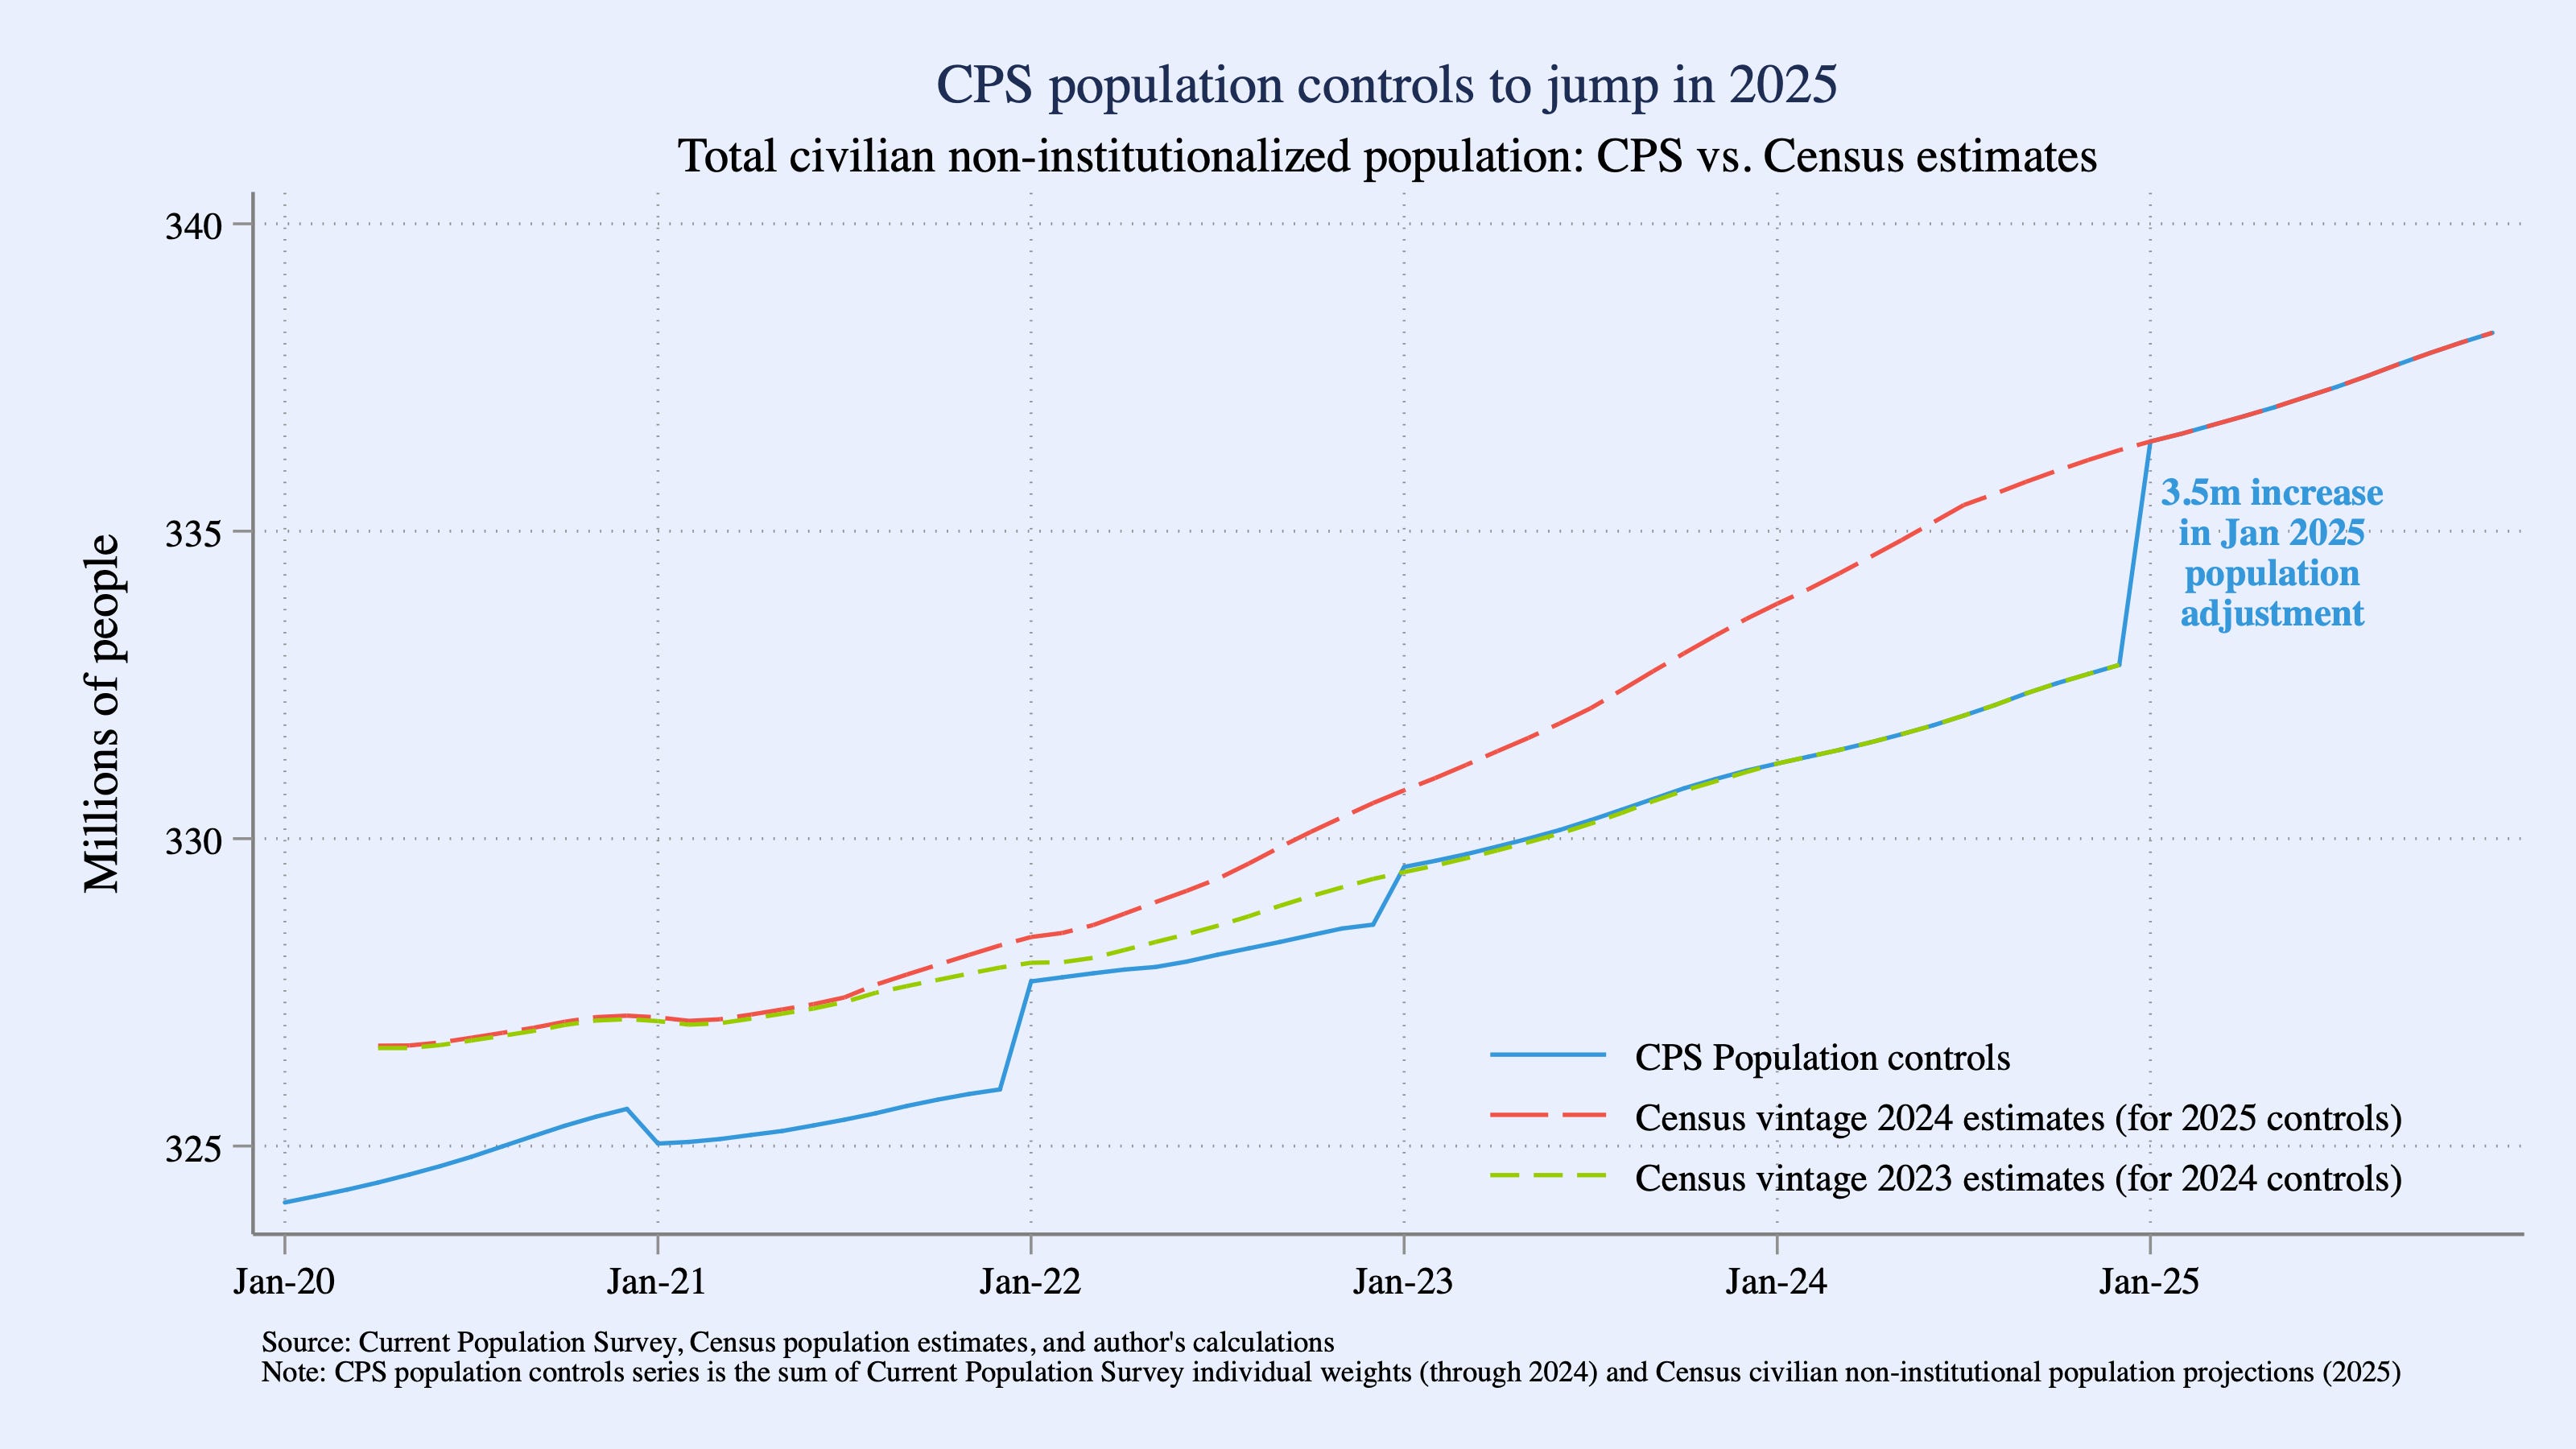
Last month, the Census Bureau revised its population estimates for December 2024 upward by 3.5 million – a huge amount. As a result, the total population as reported in the CPS will jump from just under 333 million in December 2024 to over 336 million in January 2025. In real life, of course, the population grows more smoothly, by 150-200 thousand people per month in recent years, according to the latest Census population estimates (the thin gold line in the above chart). But the CPS is not revised historically to reflect the new population estimates: rather, the new population estimates affect only future data releases, starting with January 2025.
To see how these new population estimates will affect key labor market statistics, I simulated how they will be incorporated into the household survey and used them to recalculate labor market measures for December 2024. In essence, I did a simple version of what BLS does and presents as part of this annual adjustment, by (1) using the topline population estimates that Census has made public and (2) modeling additional inputs for demographic groups that BLS uses but are not yet public. (See the methodology note for details.)
New population estimates change the path of labor market data because the estimates affect both the size and the composition of the population. The big jump in the Census population estimate for January 2025 is not uniform or proportional across different demographic groups. Essentially the entire increase is due to a change in how Census counted the recent wave of immigration in the latest estimates. Recent immigrants are younger on average and significantly more likely to be Hispanic or Asian than the rest of the US population: according to the latest (2023) American Community Survey (ACS), 56% of recent adult immigrants are younger than 45 and Hispanic or Asian, compared with only 14% of the adult population. Thus, this big increase in population due to immigration will also change the estimated demographic composition of the population.
By my calculations, the upward adjustment of the total population estimate by 3.5 million along with the compositional shifts among demographic groups implies:
2.7 million more adults age 16+
2.0 million more people in the labor force
1.9 million more employed people
Since employment and the labor force have recently grown by 100-200 thousand per month on average, these population adjustments will almost certainly swamp the actual shifts in the labor market between December 2024 and January 2025.
The headline rates and ratios, however, are likely to change very little as a result of the population adjustment. The unemployment rate, prime-age labor force participation rate, and prime-age employment population ratio should all shift by at most a few hundreds of a percentage point – not enough to show up in the published data. But the labor force participation rate for the entire adult population should increase by one tenth of a percentage point. This is one rate that includes the entire adult population in the denominator and is therefore more affected by the changing age distribution of the population. It’s been falling for many years as the population ages and more people retire; but rising immigration makes the population slightly younger, on average, and therefore nudges the labor force participation rate up.
Most of the reported employment increase will be for native-born workers, but that’s a statistical quirk; ignore the changes in levels of native-born and foreign-born workers
The trickiest part of the population adjustment could be around native-born and foreign-born workers. You might think that the entire upward employment adjustment in the CPS should be for foreign-born workers since essentially the entire upward population revision in the vintage 2024 Census population estimates was due to immigration.
But that’s not how population estimates and population controls work. Age, sex, and race and ethnicity are the demographic variables for which Census produces estimates and to which the CPS gets aligned. Nativity (i.e. native-born or foreign-born) and citizenship are not in that short list of demographic variables, so there are no official Census estimates of native-born and foreign-born population that the CPS can align with. That means the increase in immigration in the Census population estimates flows through to the native vs foreign-born data in the CPS indirectly through shifts in age, sex, and race/ethnicity only.
As noted above, 56% of recent adult immigrants are Hispanic or Asian and younger than 45. But 61% of Hispanic and Asian adults under 45 in the US are native-born. Looking across all age groups, racial/ethnic categories, and sex, 64% of adults who match the demographic profile of recent immigrants are native-born. So an upward population adjustment that reflects the demographics of recent immigrants will end up primarily boosting the native-born population (and native-born employment) estimates as well.
Even though the big upward revision to the Census population estimates was due to immigration, I calculate that the 1.9 million increase in employment will be reported as:
1.34 million more native-born workers
540,000 more foreign-born workers
I expect this will generate many bad takes about immigration and the labor market. As the methodologies currently stand, one should probably never look at CPS data on the levels of native- vs foreign-born employment or their changes. That was true in recent years when Census estimates were undercounting immigrants, which filtered through so that native-born population and employment were likely being undercounted in the CPS, and it will be true in Friday’s adjustment, when the immigration-driven upward revision will appear to boost native-born employment.
Instead, to see how native-born and foreign-born workers are faring in the labor market, focus on the rates and ratios like the unemployment rate, the labor force participation rate, and the employment-population ratio, not levels.
Historical household survey data don’t get revised, but they could be and should be, and would show trends over time such as the steady growth of the labor force
Friday’s jobs report for January 2025 will show how the new population estimates shift key levels, rates, and ratios as reported in December 2024, which will make clear how much of the reported changes between December 2024 and January 2025 were due to the new population estimates versus actual changes in the labor market (last year’s breakdown of these adjustments are here). That’s incredibly helpful!
But no historical data will be revised in the household survey. BLS explicitly warns, as they do each year, that “household survey data for January 2025 will not be directly comparable with data for December 2024 or earlier periods.” That means, among other things, that data users should not look at the month-on-month change of any household survey headcounts in January, like employment, unemployment, or the labor force. As if that has ever stopped researchers from looking at trends in unemployment or labor force participation across multiple years! But that warning is more serious this year when the population adjustment is 3.5 million, much larger than the typical adjustment in recent years of about 500,000 in either direction.
This matters for understanding all labor market trends, but especially for a key policy indicator: how fast the labor force is growing. Economists and policymakers compare the monthly payroll changes in the jobs report to the growth of the labor force. If employment grows faster than the labor force, the labor market tightens and might push wages and prices higher; if employment grows more slowly than the labor force, the market slackens. The “right” rate of job growth that provides jobs for people who want them without overheating the market depends on how fast the labor force is growing.
Time for a trick question: if the labor force in December 2024 was – as I predict the Friday jobs report will show – 2 million people larger than originally reported, the labor force must have grown faster than reported, right? No! You can’t make any guesses about how the population adjustment affects the growth of the labor force unless you revise historical data using the latest population estimates, too. The BLS will not revise historical data using the latest population estimates, but I did. I modeled the latest vintage of Census population estimates back to April 2020, with the same method used above and described in detail below, and recalculated labor market measures from that date to December 2024.
The latest Census population estimates are much higher not only for the present (3.5 million in December 2024), but they are also higher for the past several years. The latest Census population estimates for 2020 and 2021 are roughly 2 million people higher than what CPS showed for those years. As shown in the above chart, the latest estimates (the long red dashed line) have been significantly higher than the population reported in the CPS (the solid blue line) for several years. The change in immigration estimates accounts for the revision between the vintage 2023 estimates (the short green dashed line) and the vintage 2024 estimates (the long red dashed line), but even the vintage 2023 estimates were already significantly higher than the earlier estimates that formed the basis for the CPS population controls in 2020 and 2021.
Furthermore, the new population estimates suggest that the population composition (not just its size) is different than the CPS showed at the time – even prior to the recent immigration wave – likely in part because of unexpectedly high death rates for older adults due to COVID. My recalculated historical CPS data based on the latest Census population estimates suggest that the labor force participation rate was almost a half-point higher in 2020 and 2021 than officially reported. Part of this gap was noted in the 2022 population adjustment announcement but subsequent updates to population estimates have added to the gap.
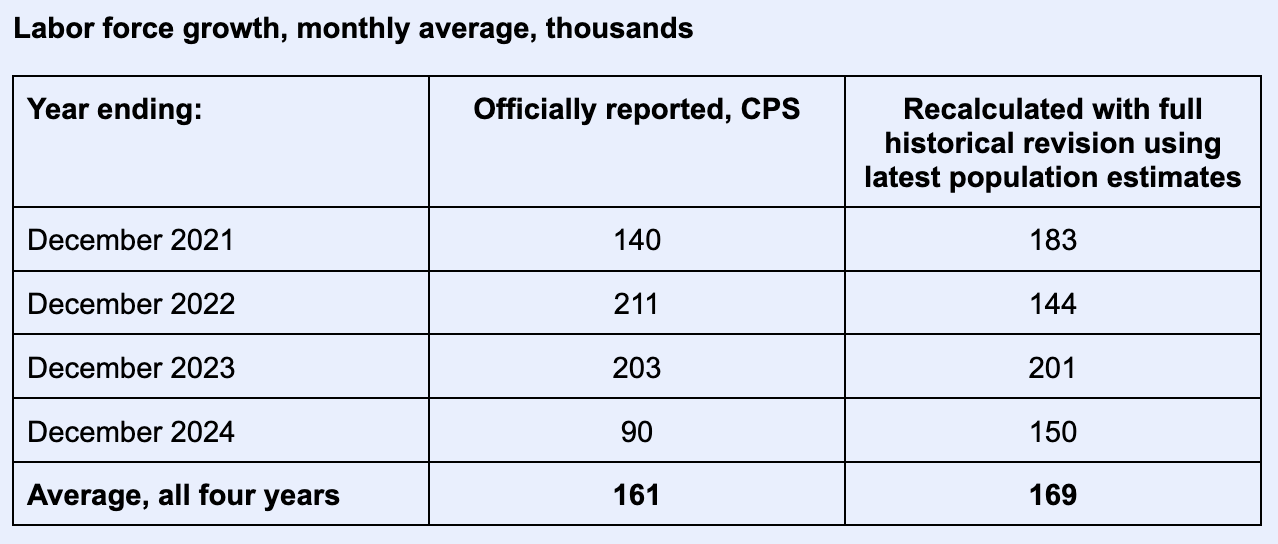
These revisions have critical implications for understanding the labor market. The latest population estimates make the labor force 2 million people larger in December 2024 and 1-2 million people larger in several previous years. However, the labor force has grown, on average, at essentially the same rate over the past four years when revised using the latest population estimates: 169 thousand per month with the full historical revision, versus 161 thousand as officially reported.
For 2024 alone, my calculation suggests that the labor force has grown faster than officially reported: 150 thousand per month when incorporating the latest population estimates, versus 90 thousand per month as officially reported. But the revision shows the labor force grew more slowly in 2022 than officially reported, for instance.
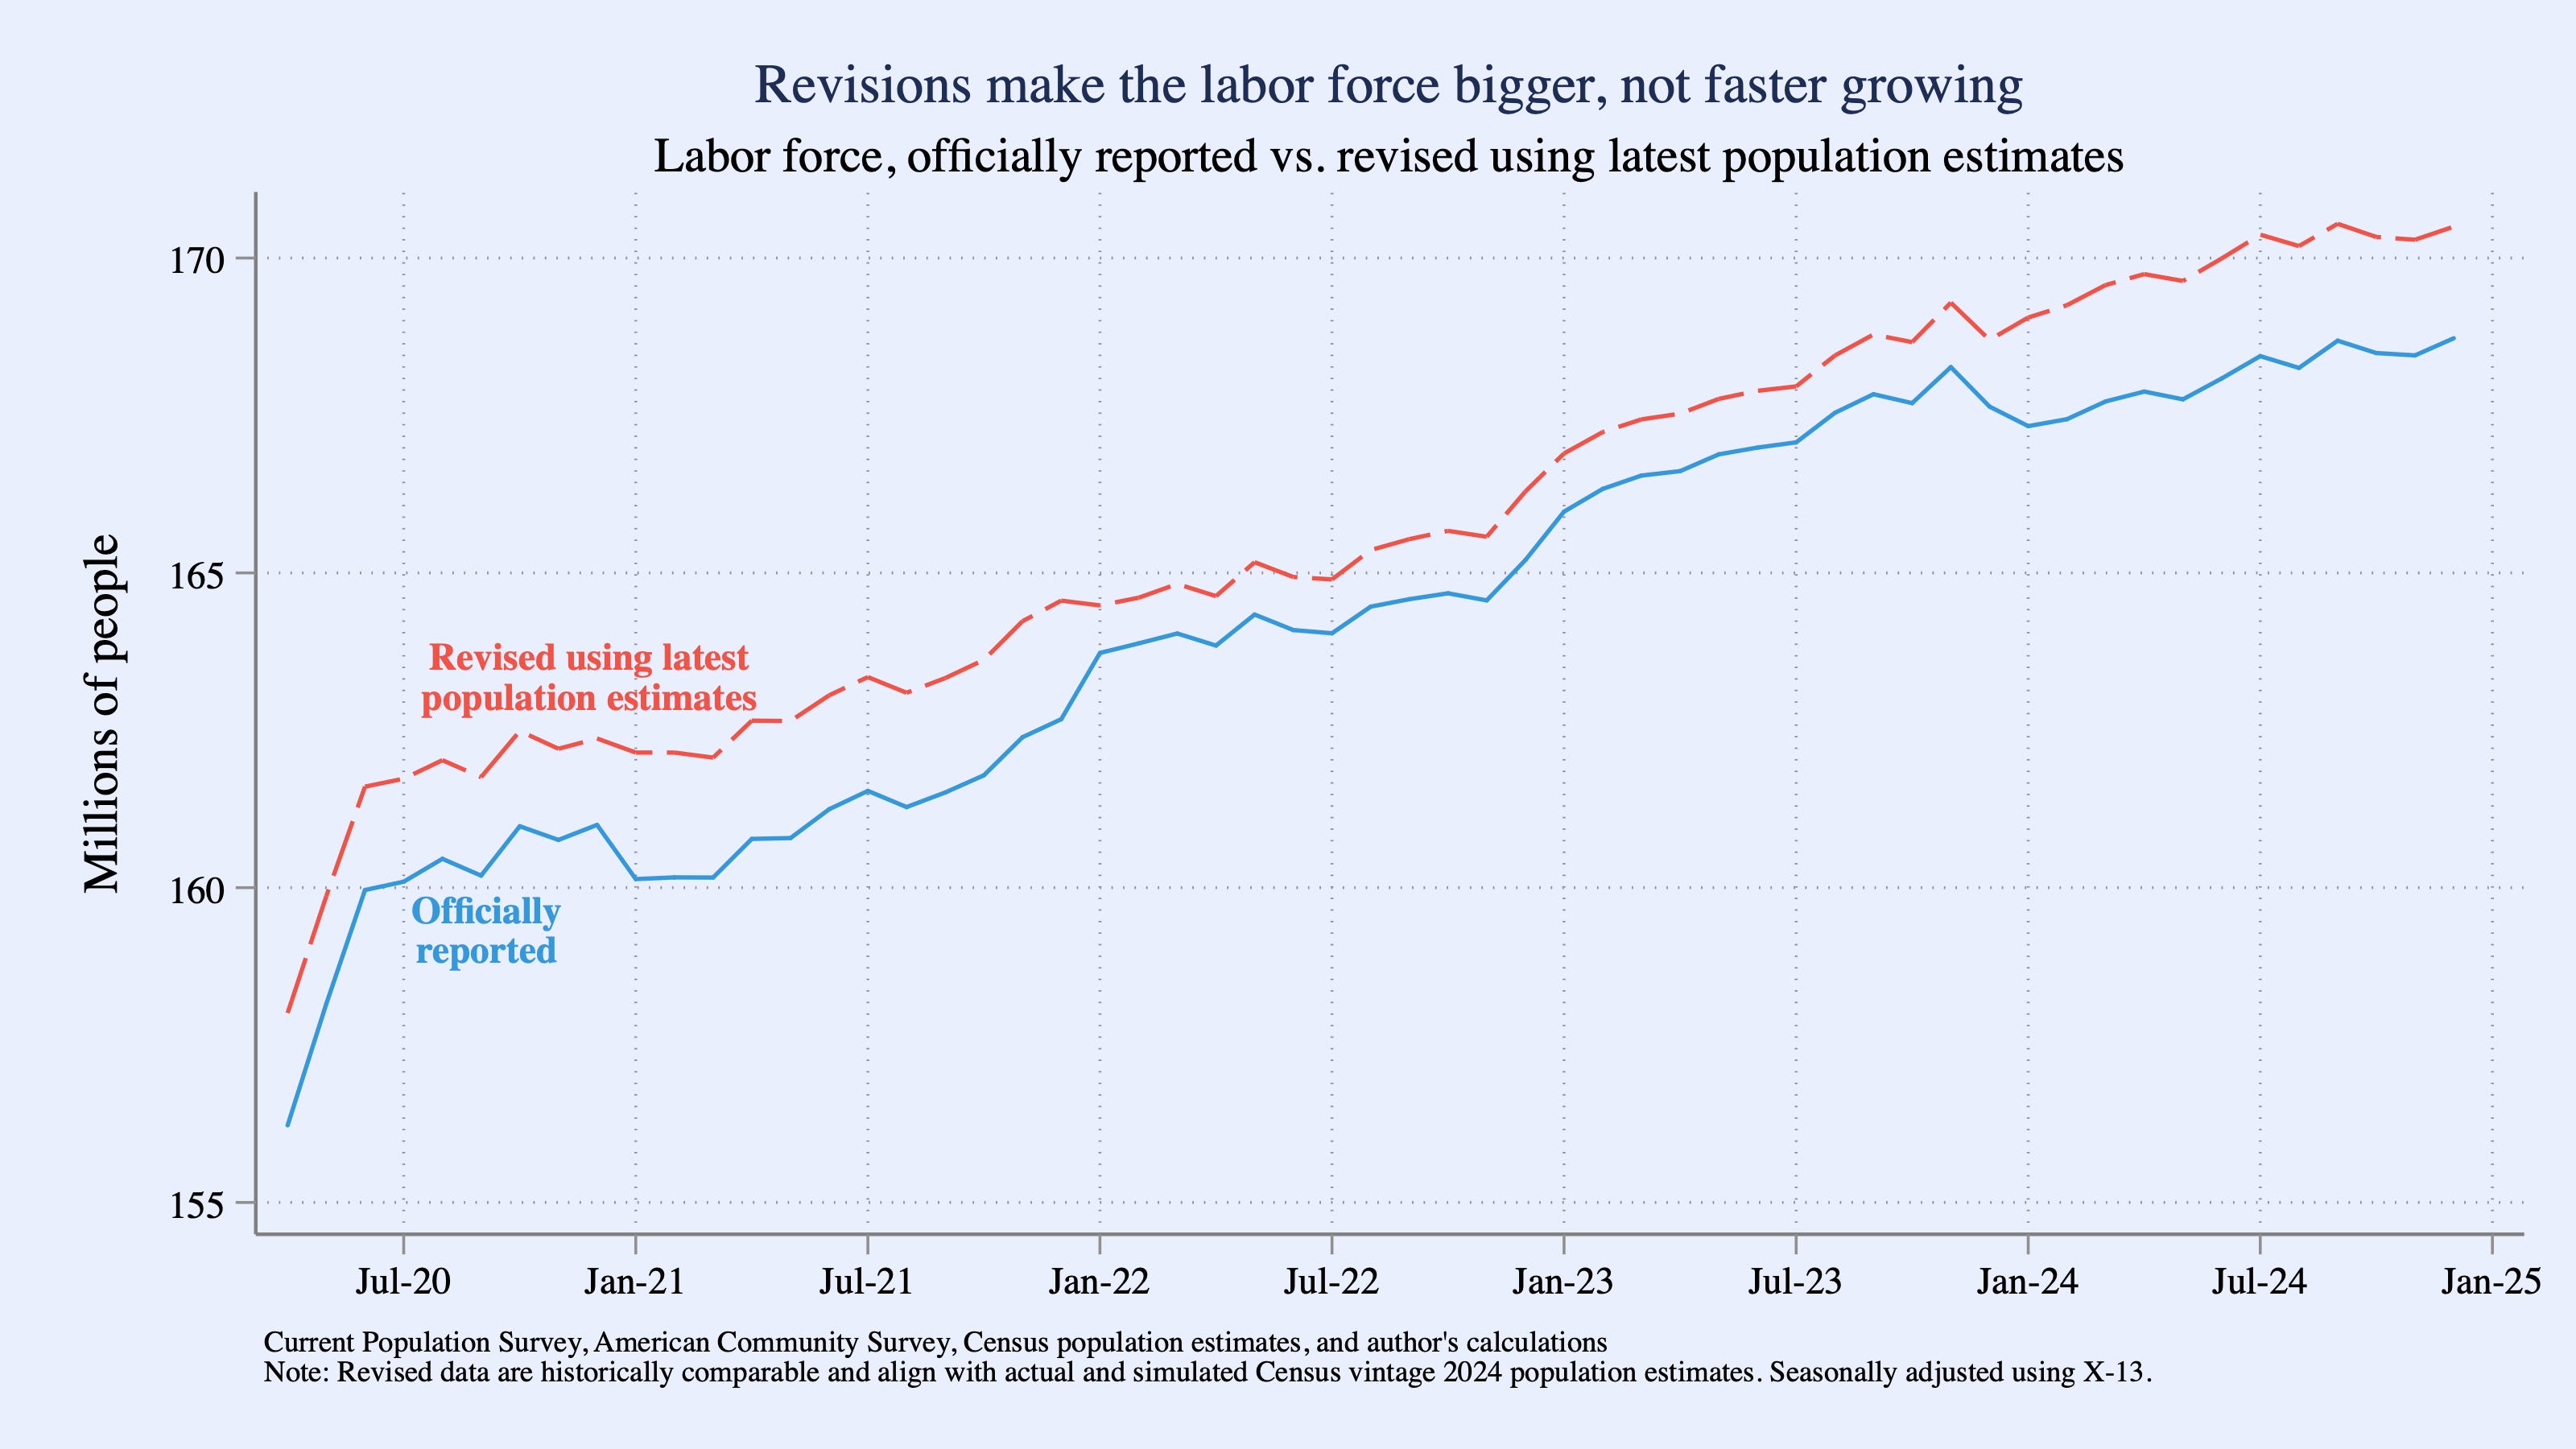
Overall, the labor force has grown more steadily but at roughly the same average rate over the past four years when revised with the latest population estimates than officially reported. Official CPS data have undercounted the size of the labor force over this whole period, by more in 2021 and 2024 than in 2022 and 2023.
The officially reported data starting in January 2025 will use the latest population estimates, so the solid blue line below will jump to meet the dashed red line. It will be essential to use historically revised data to understand how the labor market has changed between 2024 (or earlier) and 2025.
The payroll survey revision will be much easier to interpret than the household survey adjustment
The payroll survey of employers (the Current Establishment Survey) will also get an annual adjustment in this Friday’s release of the January 2025 jobs report. The payroll survey benchmark revision is quite different than the household survey population adjustment:
The payroll survey is revised to align with the Quarterly Census of Employment and Wages (QCEW), not the Census population estimates. The QCEW is based on administrative records collected by state unemployment insurance agencies.
The level of employment in the payroll survey is likely to be revised downward, even though the level of employment in the household survey will be adjusted upward. The upcoming payroll survey revision was foreshadowed last August in the preliminary benchmark announcement of a decline in 818 thousand jobs.
Most critically: the payroll survey benchmark revision IS applied historically, over the past few of employment data. That means published payroll survey data, unlike household survey data, ARE historically comparable across years.
The payroll survey benchmark revision should therefore be much easier to interpret than the household survey population adjustment. (Also, the payroll survey probably does a better job than the household survey does at counting undocumented workers.) While it might raise eyebrows that the payroll survey will likely be revised down while the household survey is adjusted up, the good news is that these updates will bring the two surveys more into alignment. Recently, the two surveys have diverged, with the payroll survey estimating over 4 million more employed people than the household survey in December 2024. A downward payroll revision of many hundreds of thousands of jobs plus an upward household survey adjustment of 1.9 million, as I estimated above, will close most of this gap.
Methodological detail
The annual population adjustment to the household survey (officially the monthly Current Population Survey, or CPS, which is jointly produced by the Bureau of Labor Statistics and the Census Bureau) aligns the survey data to the latest Census population estimates. Every respondent to the survey is assigned a weight so the 100,000-ish individual respondents represent the 330-ish million people in the U.S. Weights help adjust for sampling and response issues to make the resulting survey data as representative of the population as possible. Weights also allow survey-based estimates of the population to match independent population controls. Just to underscore: weights enable survey-based data to reflect both the composition and the size of the population.
The annual Census population estimates for the nation, states, and demographic groups are the independent population controls for the CPS. That is, the weights assigned to each respondent in the household survey add up to the Census population estimates. In the December 2024 jobs report, the CPS reported that the total civilian non-institutionalized population age 16+ was 269,638 thousand people, which equals the official Census estimate for December 2024 published here in late 2023. (CPS microdata files have several different weights. The sum of final weights matches the total civilian non-institutionalized population, and the sum of composite weights matches the adult population and the published CPS results.)
This Friday the BLS will publish the January 2025 jobs report. The household survey population totals will match the vintage 2024 Census population estimates, which were released in December 2024 and include updated estimates from the last decennial Census in April 2020 to December 2025. So far the only publicly released vintage 2024 estimates are for national and state population totals. Vintage 2024 estimates by age, sex, and race and ethnicity won’t be publicly released until June, but the statistical agencies use these unpublished estimates for demographic groups in order to create weights for the January 2025 CPS.
To anticipate how much the adjustment will change key labor market levels and rates, I calculated an alternative set of weights for the December 2024 CPS, attempting to mimic (with many shortcuts!) what BLS will show on Friday. To do this, the essential piece of information that BLS already has but is not yet public is the vintage 2024 Census population estimates by age, race/ethnicity, and sex.
To model the vintage 2024 population estimates for 96 demographic groups (every combination of 8 age groups, 6 non-overlapping race/ethnicity groups, and male/female), I allocated the 3.5 million national-population difference between the vintage 2024 and vintage 2023 Census population estimates for December 2024 across demographic groups in line with the demographic profile of recent immigrants according to the 2023 American Community Survey (ACS), which the Census Bureau also uses to identify demographic characteristics of recent immigrants for the population estimates. Then, I multiplied the sample weights in the CPS microdata by demographic-group-specific factors so that the resulting weighted sample aligned with both the published national population estimate and my modeled estimates for each demographic group.
I applied this method to all months back to April 2020, generating alternative sample weights for the entire period that align with the vintage 2024 population estimates for the nation and my modeled estimates for demographic groups. Using these alternative weights, I recalculated key labor market levels, rates, and ratios.
Where I report seasonally adjusted data, I do my own seasonal adjustment using X-13 on data series calculated from the microdata, with either the original official weights or my alternative updated weights.
There are several next research steps as more data get released:
When the January 2025 CPS microdata are released, likely in mid-February, it will be possible to back out the vintage 2024 population controls for each demographic group and incorporate those into my modeled demographic-group population estimates for the entire period.
When the vintage 2024 population estimates for age, sex, and race/ethnicity for the entire 2020-2025 period are released in June, they would replace my modeled demographic-group population estimates.
In theory one could create weights for the CPS that include nativity as part of the population controls. That would depend on having defensible estimates of the native- and foreign-born population over time, which the Census Bureau does not currently create as part of its population estimates program. It is worth exploring whether other data exist that could help construct population estimates for nativity alongside age, sex, and race/ethnicity.
All microdata from the Current Population Survey and American Community survey used in this research were downloaded from IPUMS, an invaluable resource.
Subscribe to Briefing Book
 | A guest post by
|
Awesome article! My fear at this point is that within a year or so that the monthly jobs report and other government reports will no longer reflect reality. I think there will be a replacement of personnel in each department with people who have proved their loyalty to Trump in order to be hired. Then I believe each department will have their monthly numbers reviewed by the White House (or, at least, a director loyal to the administration) before publication. Similar to Florida requiring all counties to send health data to Tallahassee and the numbers released from there, which amazingly showed fewer Covid deaths than other states though a spike in pneumonia deaths. It will be like assuming that the official numbers from the Kremlin actually reflect reality. One result will be that if Jed decides to write a similar report next year, where will he get his data from?
Assuming there is a report, what, if anything, might this do to the headline number of jobs created last month?