Introducing the Low-Wage Index: A Compositionally-Adjusted Look at Low-Wage Workers Since 1979
The current labor market is one of only two since 1979 with sustained wage pressures for low-wage workers

“Are workers better off than in the past” is one of the most common questions asked in economics—so common, in fact, that it’s just as likely to be a non-economist asking it. Yet for all of its deceptive simplicity, the question quickly leads the questioner down dark labyrinthine branches of methodological and conceptual struggles. Is the underlying concern one of welfare? Productivity? Unit labor costs? For that matter, do we just care about labor earnings or all income? Do we give a gain in earnings from changing occupations or going to college the same weight as a raise in the same job? And of course, there is the ultimate nightmare question: how do we adjust for inflation?
But there are additional questions too that usually aren’t considered at all in the context of low-wage workers that are important. The population has gotten older over time and more educated. The workforce looks different too, with more workers in services and fewer in manufacturing. Shifting populations means that comparisons of workers aren’t apples-to-apples over time. Often, we want to know how well a low-wage worker fared in America as it was in some year in the past versus a low-wage worker today. But it might also be valuable to understand how much shifting composition explains growth in low-wage earnings, as a way of better identifying fundamental economics conditions for low-wage workers.
This piece presents preliminary work on an experimental index that attempts to shed light on specific pressures affecting low-wage workers while controlling for a variety of factors. It does this by holding several different dimensions of the labor market fixed over time—sex, age, industry, occupation, and education—so that compositional effects are minimized. What remains is, hopefully, a measure of the fundamental forces driving low-wage earnings.1
A brief introduction to and motivation for the Low-Wage Index
The Low-Wage Index (LWI) is partially inspired by another compositionally-adjusted index, the Employment Cost Index (ECI) published by the Bureau of Labor Statistics, but uses different data, measures a different concept of wages, and serves a different purpose.
The headline LWI measures real weekly earnings for the 25th percentile of workers; indices for the 10th, 50th, and 75th percentiles are calculated too.2 All LWIs are compositionally-adjusted to match the population and labor market profiles of 2023 over time along several dimensions: sex, age, race, college educaiton, and broad industry and occupation (more methodological details further in the piece).
What the LWIs give researchers that no other measure does is a measure of wage pressures at different points in the distribution independent of compositional factors–the aging of the population, for example, which might otherwise be expected to gradually raise measured average wages, or the increase in educational attainment, which would have the same effect. The point of course is not that these compositional factors are worth ignoring–quite the opposite–but that compositionally-controlled wage pressure can provide valuable insight about economic conditions for workers.
The bottom line up front
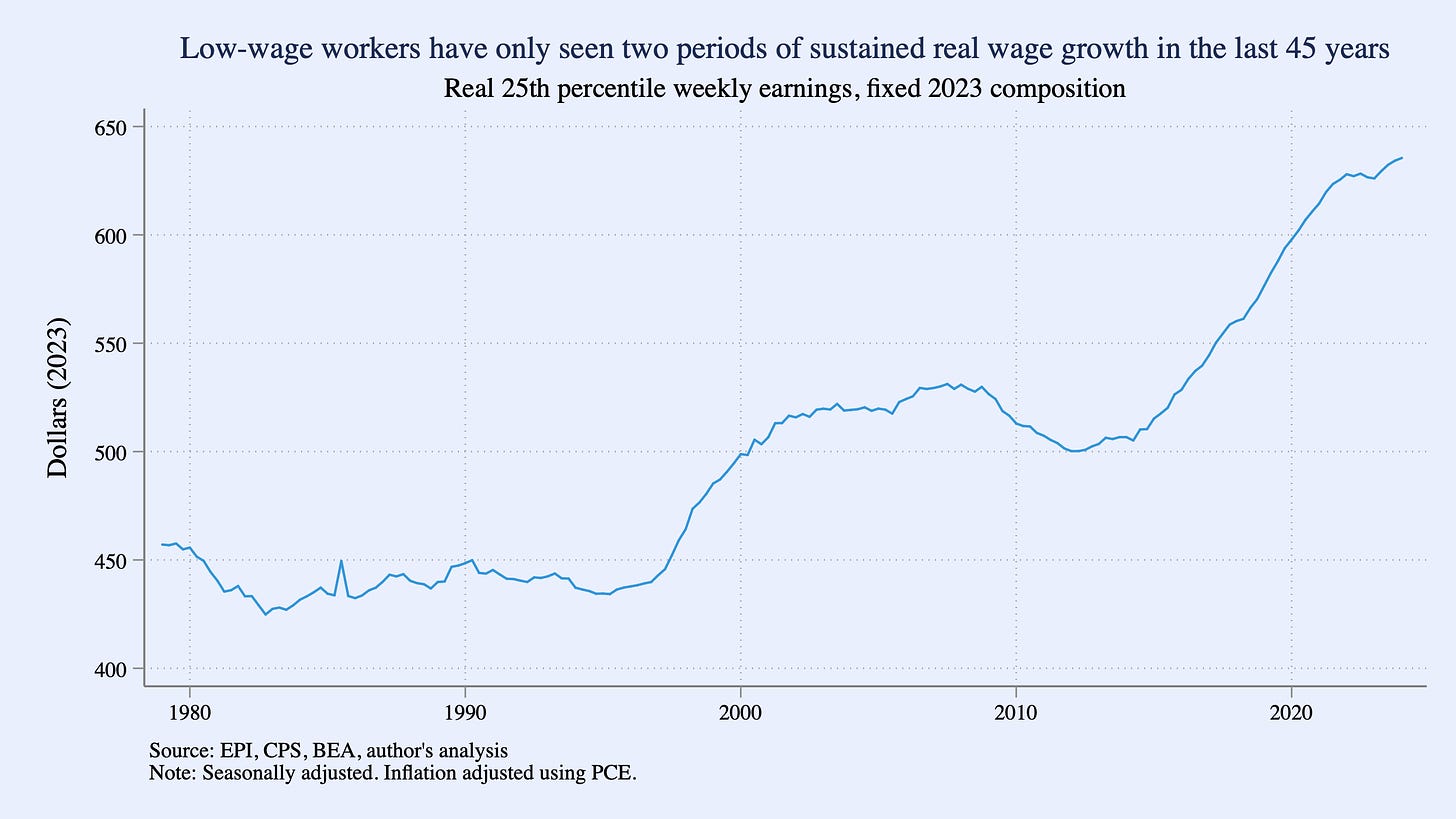
According to the Low-Wage Index (LWI), since 1979, there have only been two sustained periods of upward real wage pressure for the 25th percentile. Real wage pressure at the bottom has not stagnated over the last 50 years. But neither has it been steady and consistent. A worker at the bottom quartile with a 2023 profile would have made roughly the same in 1997 each week as 1979, about $450 a week in 2023 dollars. But then in the hot economy of the dot-com boom, real wages at the bottom finally grew. The LWI goes from barely budging for twenty years to growing 20% over the 1997-2007 period.
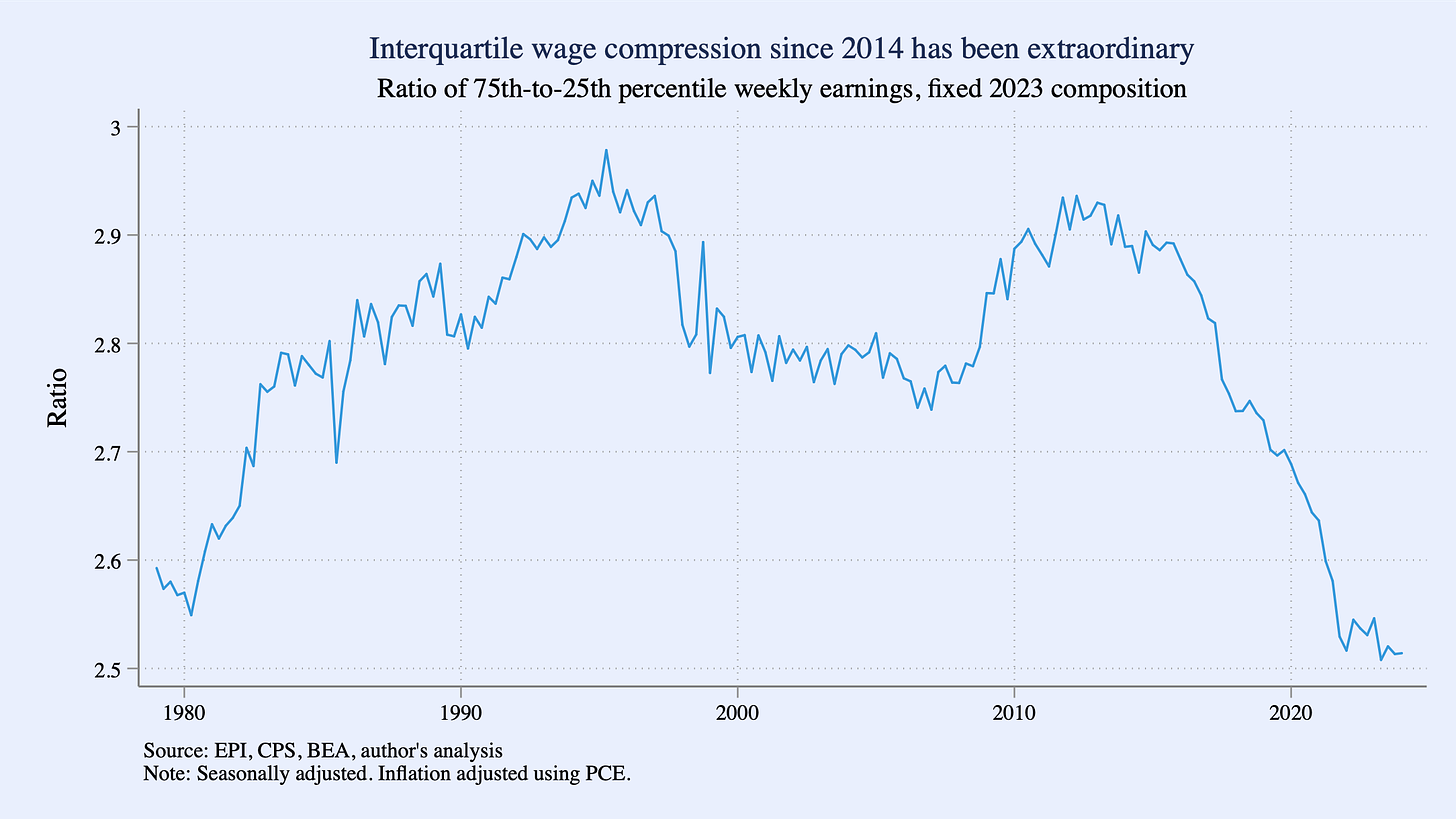
The Great Recession hit, and for a time, low-wage workers saw wage pressure cool. In 2014, it began a second acceleration that, interestingly, continued throughout the pandemic. The low-wage index has grown by 25% over the last 10 years, an even stronger growth record than in the wake of the dot-com boom.The LWI suggests recent wage compression since 2014 has been extraordinary. The ratio of the 75th-to-25th percentile wage has steadily fallen since 2014, from 2.9x to 2.5x, the lowest level since data begin in the late 1970s. This suggests that the factors driving low-wage growth are helping low-wage workers disproportionately more than higher-wage workers when controlling for other factors.
Low-wage workers have out-grown higher-income workers throughout the pandemic. This is consistent with unadjusted data as well, such as that presented in Autor, Dube, and McGrew (2023). The LWI is consistent with the building consensus that the pandemic was a recession unlike any other recent one.
In conclusion, the LWI suggests that low-wage workers have wage tailwinds only in fits and starts. Workers often make gains by climbing career or educational ladders. Latent upward wage pressure for low-income workers however is rarer. Happily, one of the those periods appears to have been over the last 10 years and is continuing now. The strong labor market of the late Great Recession recovery and the last few years, interrupted temporarily by the sharp but relatively rapid pandemic shock, appears to have sustained persistent wage pressures for low-income workers.
Building the index
Why is a compositional adjustment important?
Unadjusted wage data gives important snapshot information about the economy and workers at a specific point in time. But over time, both the economy and workers can change. The US population, for example, is older on average than it was fifty years ago. Over that same period, the labor market has shifted away from manufacturing and towards services. Workers generally have gained more educational attainment.
Going back to the question posed in the introduction to this piece: all of these developments have affected wages. The purpose of the LWI however is to (try to) isolate the component of wage growth for low-income workers in the data that is not due to compositional shifts: because the population got older, got more educated, etc.
A Brief Overview of Current data
Employment Cost Index
The goal of the LWI is inspired by the Employment Cost Index (ECI) released by the Bureau of Labor Statistics (BLS), a compositionally-adjusted hourly wage index whose purpose is not to understand the dynamics of well-being, but rather labor cost pressures. As such, ECI is only compositionally-adjusted by industry and occupational group, not by demographic data. The ECI is calculated from the National Compensation Survey. It contains some industry and occupational data, but no demographic or income distributional data.
Usual Weekly Earnings
This release from BLS uses data from the Current Population Survey (CPS) and has the widest overlap with the data shown in our compositionally-adjusted indices. These data cover usual weekly earnings, but just for full time wage and salary workers (part time workers are in a separate release). The median goes back to 1978 Q4; selected other percentiles only go back to 1999 Q4.
Atlanta Fed Wage Growth Tracker
Researchers at the Federal Reserve Bank of Atlanta produce an index of median wage growth from longitudinally-linked records in the CPS. Because its linked records must, by definition, be employed and earning wages in both months of the panel, the Wage Growth Tracker (WGT) is compositionally static across its panel months (but can drift over time).
Methodology for the LWI
Data source
The index uses the BLS CPS microdata as its basis. In particular, it makes use of the excellent Outgoing Rotation Group extract from the Economic Policy Institute (EPI), which has consistent and transparent methodologies for calculating many earnings variables over time.3
Wage measure
The LWI measures usual real weekly earnings (for all workers, not just those usually full-time) at different percentiles of the compositionally-adjusted distribution. I chose weekly earnings as it is a more complete measure of worker labor income than hourly earnings (arguably a more appropriate metric for questions around productivity or unit labor costs), and hours can be a margin of variation and uncertainty for the worker. In fact, for these latter workers whose hours vary, usual hours must be imputed in the CPS, introducing a layer of imprecision in household survey hourly earnings data not present in weekly earnings.
The indices are quasi-percentiles: they are triangle-weighted averages centered at the 10th, 25th, and 50th percentiles.4
Compositional Adjustment
Survey weights to the index are raked so that the wage-earning population in each month since 1979 resembles its 2023 profile along five different dimensions:
Sex and age (24 categories);
College graduate status and potential experience (18 categories);
Harmonized industry (16 categories);
Harmonized occupation (10 categories); and,
Sex, race, and ethnicity (8 categories).
Later on, the final indices are adjusted for two more compositional shifts. One is the shift to the computerized CPS beginning in 1994; this level shift in each index is identified with a random walk model of the indices’ log changes with seasonal controls. Statistically significant shifts at 1994 Q1 are compensated for prior to 1994. Only the 10th and 25th percentile indices appear to show significant shifts in 1994.
The second are residual spikes in the indices in the depths of the pandemic in 2020 Q1 and Q2. The raked weighting procedure above mitigates some of the compositional effects present in the raw usual weekly earnings series. But spikes in measured real weekly earnings remains. There is no similar surge in pay over this period in longitudinally-linked household survey measures of earnings, such as the Atlanta Fed Wage Growth Tracker.5 This suggests the 2020 surges represent compositional phantoms rather than signals of real phenomena. I control for spikes in these two specific quarters using a random walk model with seasonal controls and year-quarter dummies.
Price Deflator
Few choices in economics are as fraught as the price deflator for wages and income. For short-run questions of inflationary pressures, economists may prefer to use fixed-weight or other non-chained price indices, as they may want to understand the full cost burdens being borne by consumers, without implicitly burdening the consumer with any of that cost in the form of substitution. But over longer periods of time, it is almost always more appropriate to use a deflator series that accounts for household substitution—which means a Fisher chained index—and has as consistent a methodology as possible over time (see Appendix A of Ozimek, Lettieri, and Glasner (2024) for an excellent discussion). The only consumer deflator that meets these criteria and spans the entire sample period since 1979 is the personal consumption expenditures (PCE) price index, published by the Bureau of Economic Analysis (BEA). Therefore, that is the deflator used for the LWI.6 The levels are in 2023 dollars.
Seasonal Adjustment
Each index is seasonally-adjusted using X-13ARIMA-SEATS.
Future work will include a 90th percentile measure.
Economic Policy Institute. 2024. Current Population Survey Extracts, Version 1.0.53, https://microdata.epi.org.
So, for example, the 25th percentile is the triangle-weighted average of the 21st through 29th percentiles, with weights of 1/25, 2/25, etc. This weighted index is then level-adjusted to equal the long-run post-1994 average of the 25th percentile alone.
I also experimented with using the Chained Consumer Price Index (C-CPI-U), backcasted pre-1999 using PCE. The results were not qualitatively much different in interpretation, and while chained CPI arguably has a more consumer-oriented set of basket weights, splicing the two series to be able to span the whole sample made the deflator less not more consistent over time.


