Immigration and the U.S. economy since the pandemic: an accounting exercise
Immigrants have been an important part of America's recent extraordinary economic growth

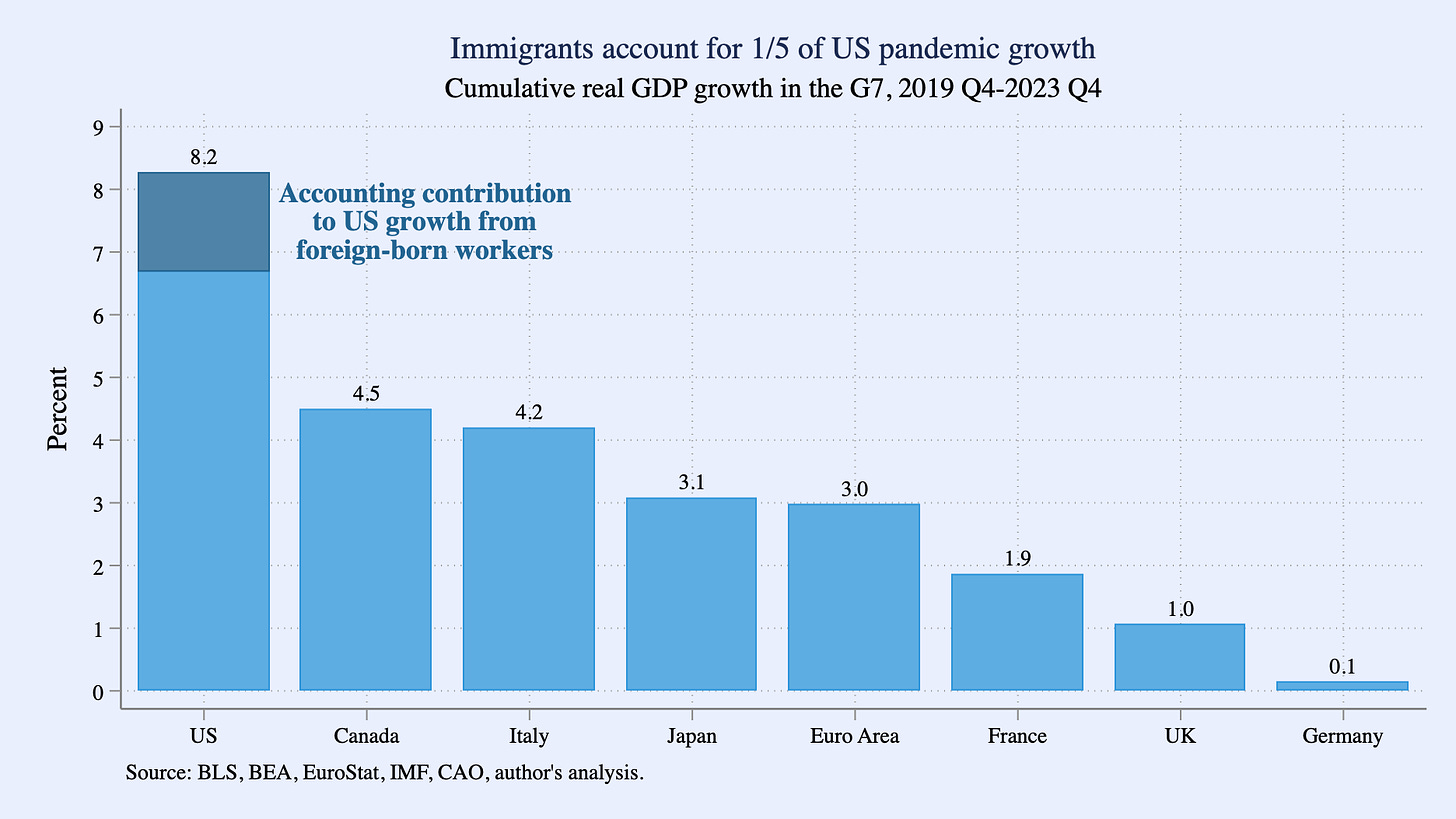
US GDP has grown by 8.2% since just before the pandemic, almost twice as fast as the next-best performer in the G7. The rise in the immigrant population since the end of 2019 accounts for at least a fifth (1.6 percentage points) of that US growth, accounting for direct labor supply, unemployment rate, and productivity effects. Absent immigration, the US labor supply would have shrunk by 1.2 million since 2019. Instead, it expanded by 2 million.
The U.S. saw faster growth than our peers during the pandemic, and with middle-of-the-road inflation
The US economic recovery from the pandemic has been extraordinary. In the four years since 2019 Q4, the last quarter before COVID-19 hit, the inflation-adjusted size of the US economy (real gross domestic product or “GDP”) has grown by a cumulative 8.2%. That performance so far is much stronger than America’s Great Recession recovery: four years into that business cycle (2007 Q4 to 2011 Q4), US real GDP was only 1.8% larger than its pre-recession level. It is also faster than the pandemic experiences of our peer advanced economies. As Figure 1 below shows, US cumulative economic growth since 2019 Q4 has been almost twice as fast as the next strongest performer in the G7, despite US cumulative core inflation being in the middle of advanced country experiences.1
One driver of US economic growth over the last four years has been immigration. Immigration affects economic growth in multiple ways. One is just the direct mechanical increase in labor supply: more workers can produce more goods and services. Another is indirect spillover effects that can lead to greater innovation and more income and consumption among native-born workers over time.
This analysis partially quantifies how the rise in the foreign-born population since the end of 2019 has moved the US economy using a growth accounting identity framework. It cannot account for all channels, especially indirect ones, but it does roughly quantify how both lawful and unlawful immigration has directly affected labor supply, the unemployment rate, and the composition of productivity in the US.
Accounting identities can be useful tools for thinking about economic growth
This analysis seeks to shed light on the question, “How strong would US economic growth since 2019 have been without immigration?” The workhorse of the analysis is a decomposition of GDP based on a simple accounting identity. Since an accounting identity only attributes direct effects to immigration, it is likely an underestimate of the true economic effect of recent immigration, and even more likely an underestimate of the long-term effects. Other channels uncaptured by accounting identities–spillover effects from innovation, for example–are discussed later.
Accounting identities are not models in and of themselves and are not causal relationships. But they can be useful forensic tools when their underlying pieces have economic meaning. For example: by definition, a country’s output growth is the product of growth in its quantity of labor supplied and growth in its amount of output per worker, or “productivity.”2 More formally:
where Y is real aggregate output (GDP), E is aggregate employment, and L is the labor force. Notice that Equation 1 is an identity because all of the non-Y terms cancel out. More importantly for interpretation, each of the ratios in Equation 1 has important independent meaning in labor and macroeconomic analysis. Recast in log differences, Equation 1 can be summarized as follows:
The rest of this piece tackles each of the terms in Equation 1 in reverse order.
Immigrants account for the entire expansion of the US labor force since 2019
Equation 1 implies that, all else equal, a growing supply of labor helps drive economic growth. The mechanisms here are straightforward: a larger labor supply means more capacity for new businesses or firms to expand. It may also imply stronger aggregate demand.
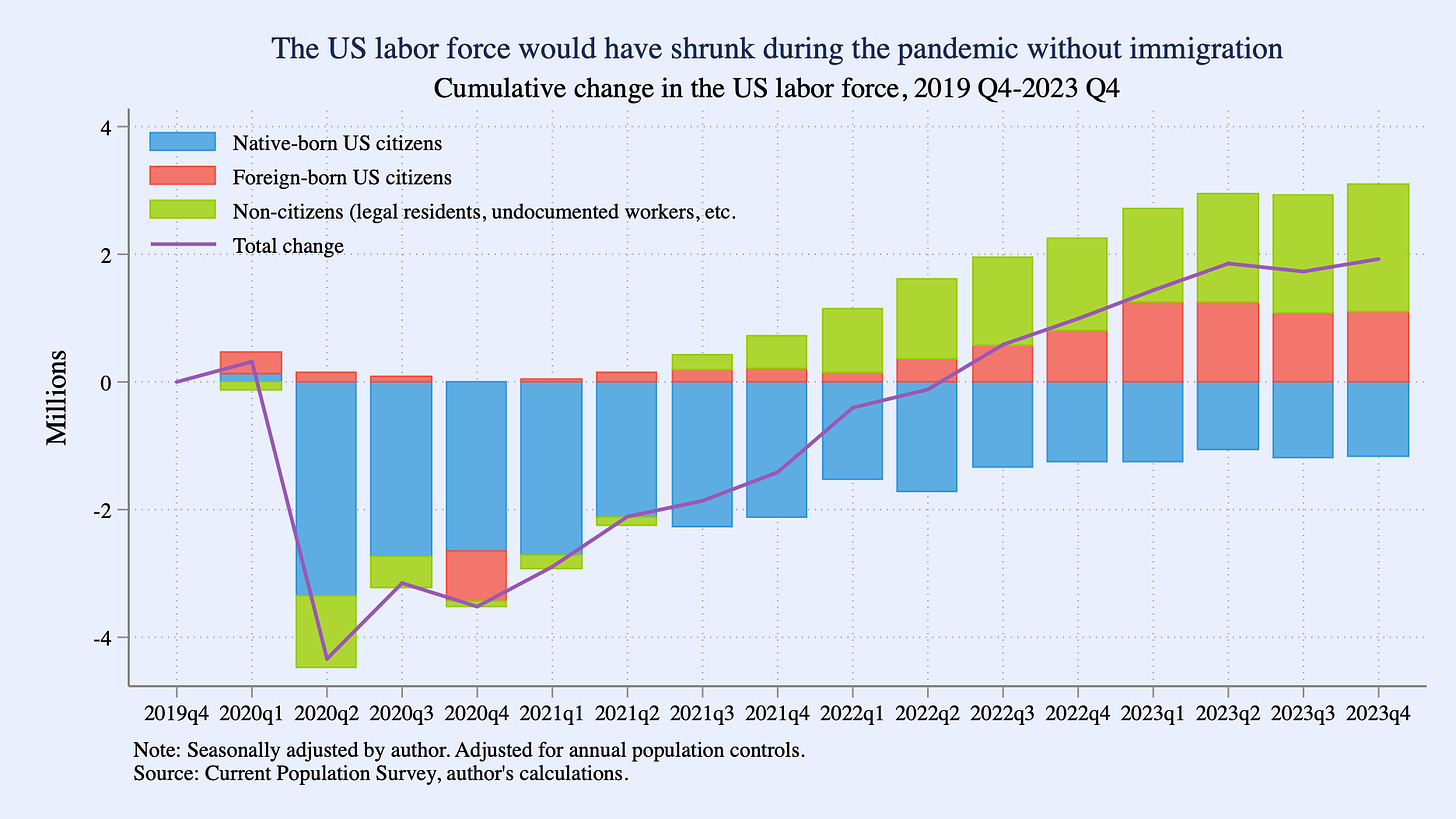
Figure 2 shows that between the end of 2019 and the end of 2023, the native-born US labor force (workers who either had or actively wanted a job) fell by 1.2 million.3 This decline was driven overwhelmingly by the aging of the native-born population: in 2019 Q4, about 21% of the native-born civilian adult population was 65 or older; in 2023 Q4, this share had risen to 23%.
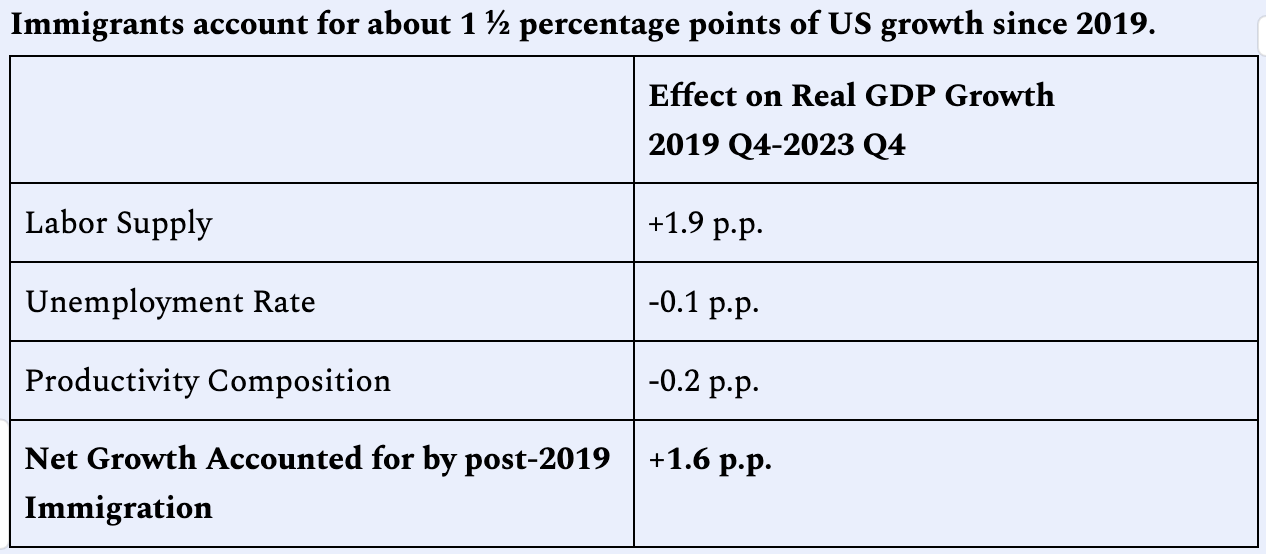
In a counterfactual world without immigration, then, the overall US labor force would have shrunk over the past four years, placing a meaningful ceiling on aggregate growth.4 Instead the US labor force grew by about 2 million. That is because immigrants more than filled in the labor hole dug by native-born workers, as Figure 2 shows. The foreign-born labor supply expanded by about 3 million, with 1 million of that from naturalized US citizens and 2 million from non-citizens, which includes immigrants with both legal and non-legal status.5 This immigrant contribution on its own expanded the labor force by 1.9% over the four years following 2019 Q4. That +1.9 percentage points constitutes the “L” in Equation 1.
Immigrants supported pandemic employment growth, though native-born workers account for a greater share of more recent gains
The second piece of Equation 1 is labor force utilization, or (E/L). This measures the share of the workers who are employed among those who actively want and can take a job. Since the labor force is just equal to the number of employed plus the number of unemployed, (E/L) is equivalent to (1-U/L), which is (1-Unemployment Rate).
This piece breaksdown household employment first, since it is the measure it will use as the “E” in Equation 1.6 Since the end of 2019, household employment has grown by 1.9 million, shown in Figure 3. The story parallels that of the labor force seen in the last section: native-born household employment has fallen since 2019, almost entirely because of aging, while foreign-born employment has grown. To give a sense of solely the recovery period of the pandemic cycle, Figure 3 also shows the portion of household employment growth just over the last three years since 2020 Q4. That post-2020 story is materially different from the post-2019 story: household employment has grown by roughly 10 million since the end of 2020, more than half of which is accounted for by native-born workers. The differences between changes since 2019 and 2020 reflect differences in the relative magnitude and timing of pandemic impacts on the different populations, the different age profiles of the populations, and other factors.
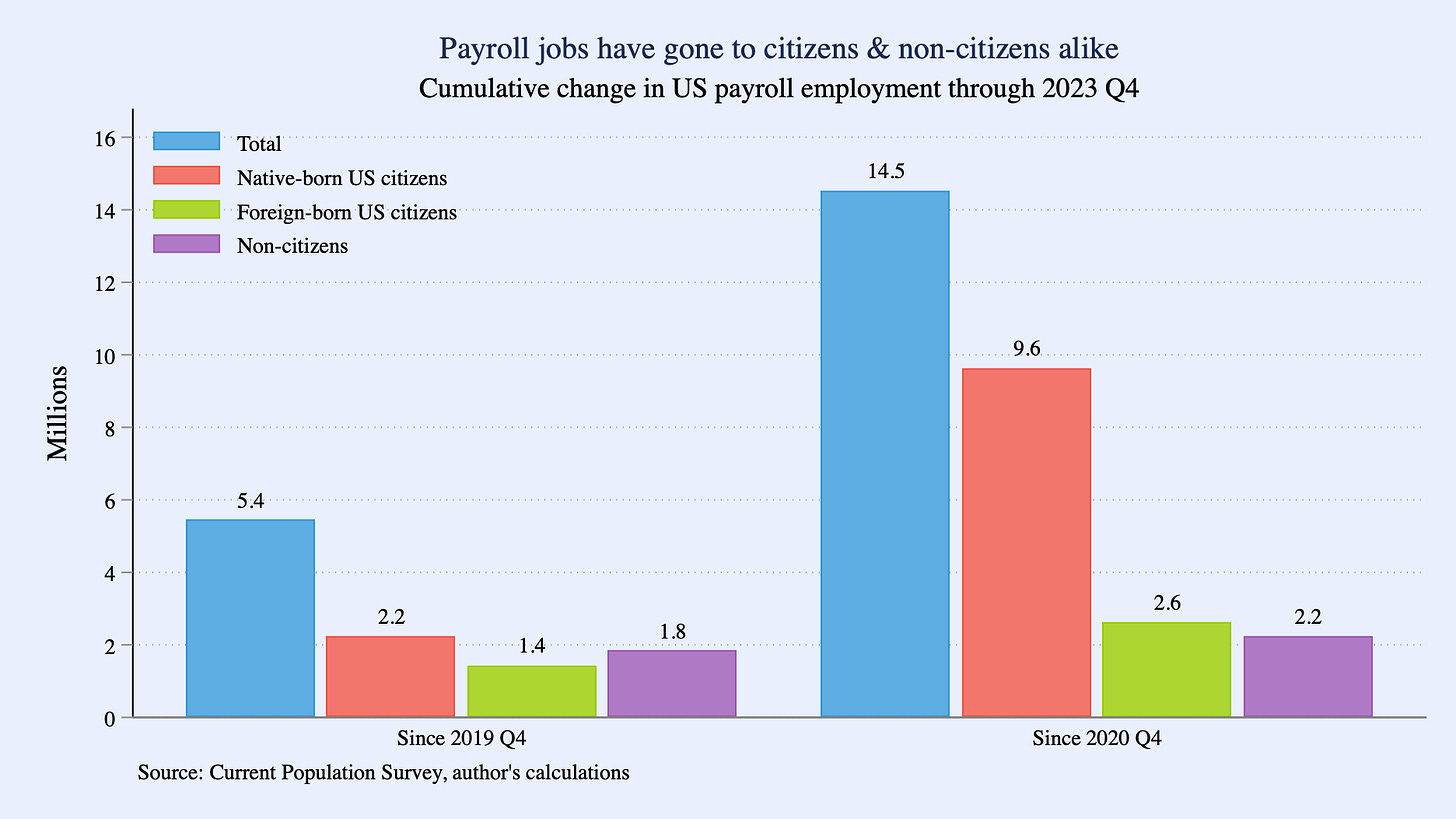
Nonfarm payroll employment is a different concept from household employment, but it is the most commonly-cited source of job growth numbers in the US every month with the release of the Employment Situation, so Figure 4 decomposes that measure too. Since end-2019, payroll employment has grown by about 5 ½ million, more than twice as much as the household employment change over the same period. Moreover, rather than shrinking, native-born payroll employment has grown by 2.2 million, more than that for naturalized citizens (+1.4 million) and non-citizens (+1.8 million).7 Since the end of 2020. payroll employment grew by 14 ½ million, ⅔ of which stemmed from higher native-born employment.8
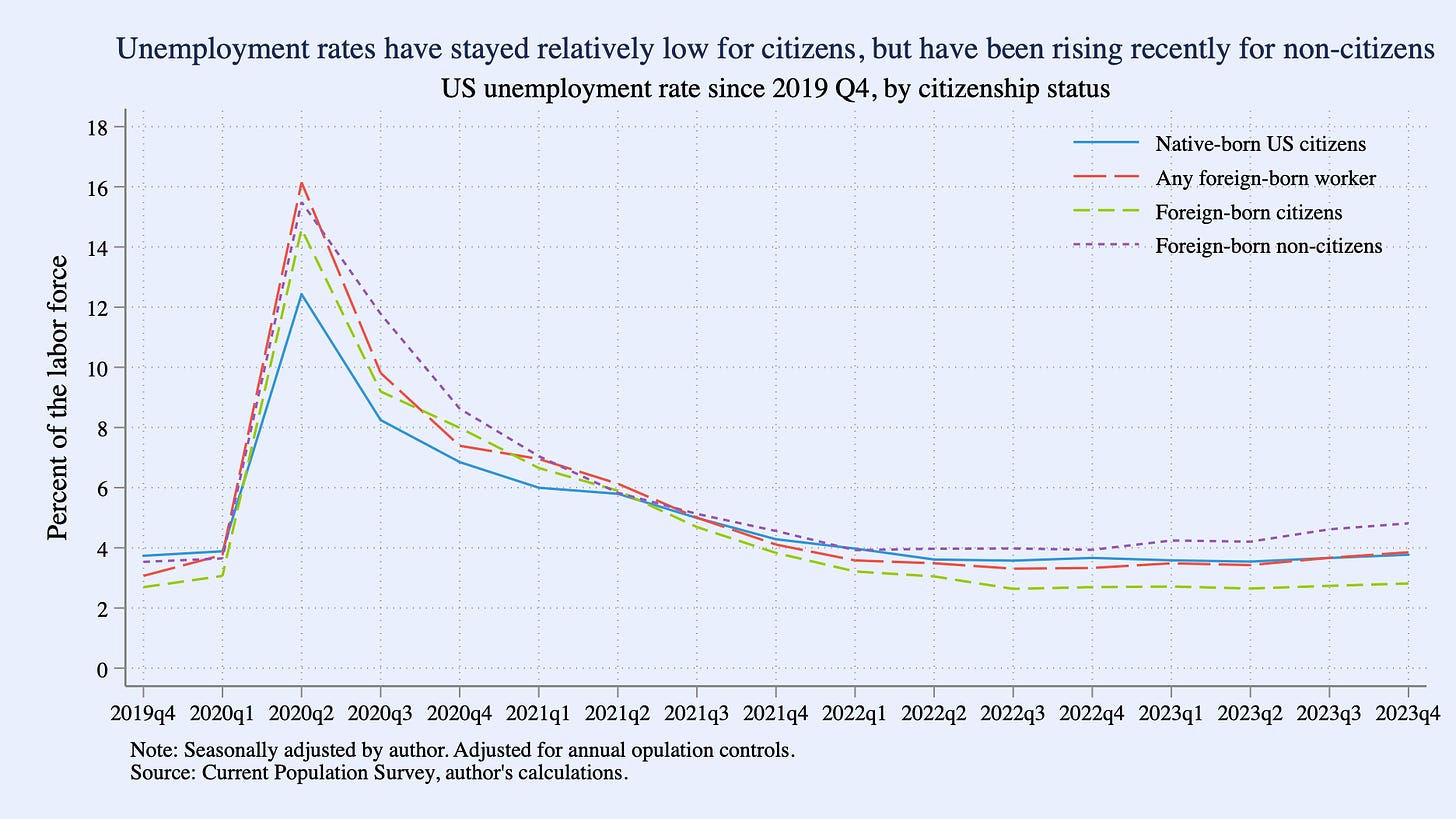
As a result of these employment and labor dynamics, the unemployment rate broadly spiked for all subpopulations through mid-2020 and then fell thereafter (see Figure 5). Both native-born and foreign-born US citizens were at roughly the same unemployment rates at the end of 2023 (3.8% and 2.8% respectively) as they were at the end of 2019 (3.7% and 2.7%) and have stayed at roughly the same low levels for the last two years. The non-citizen unemployment rate however has grown recently and is now higher than pre-pandemic: 4.8% in 2023 Q4 versus 3.5% in 2019 Q4.9
Circling back to Equation 1: for the purposes of the GDP accounting exercise, the unemployment rate for all foreign born workers–both citizens and non-citizens–has risen to 3.9% from 3.1% pre-pandemic. This implies that lower labor force utilization among foreign-born workers raised the national unemployment rate by roughly 0.1%, and so subtracted about 0.1 percentage point from GDP growth since the end of 2019.10
Immigrant worker productivity likely kept pace with native-born workers
The final term in Equation 1 is productivity, which in the context of this analysis refers to output per worker or (Y/E). Immigrants affect both the level of productivity and productivity growth in different ways and at different time horizons. For example, immigrants have a simple, direct accounting effect on the level of productivity that depends on the compositional mix of the foreign-born population. More immigrants in high-wage industries such as H-1B visa holders likely raise average productivity levels, while more immigrants in lower-wage sectors likely lower it. It is important to recognize that in the short-run these are pure compositional effects on aggregate productivity, and do not identify effects of immigration on the productivity of the typical native-born worker. Immigration also has longer-term effects on productivity growth that accrue over time, raising it due to more efficient task specialization (Peri 2009), innovation measured for example by number of patents (Bernstein et al 2022), and higher rates of entrepreneurship (Kerr & Kerr 2019).
Productivity is even more uncertain to measure than the labor force and employment estimates in this analysis. No comprehensive economy-wide data on productivity by individual worker exists. To overcome this limitation, a conventional assumption in labor economics is that worker productivity changes over time in proportion to a worker’s compensation or wage. This is a reasonable first approximation and so is adopted here.11
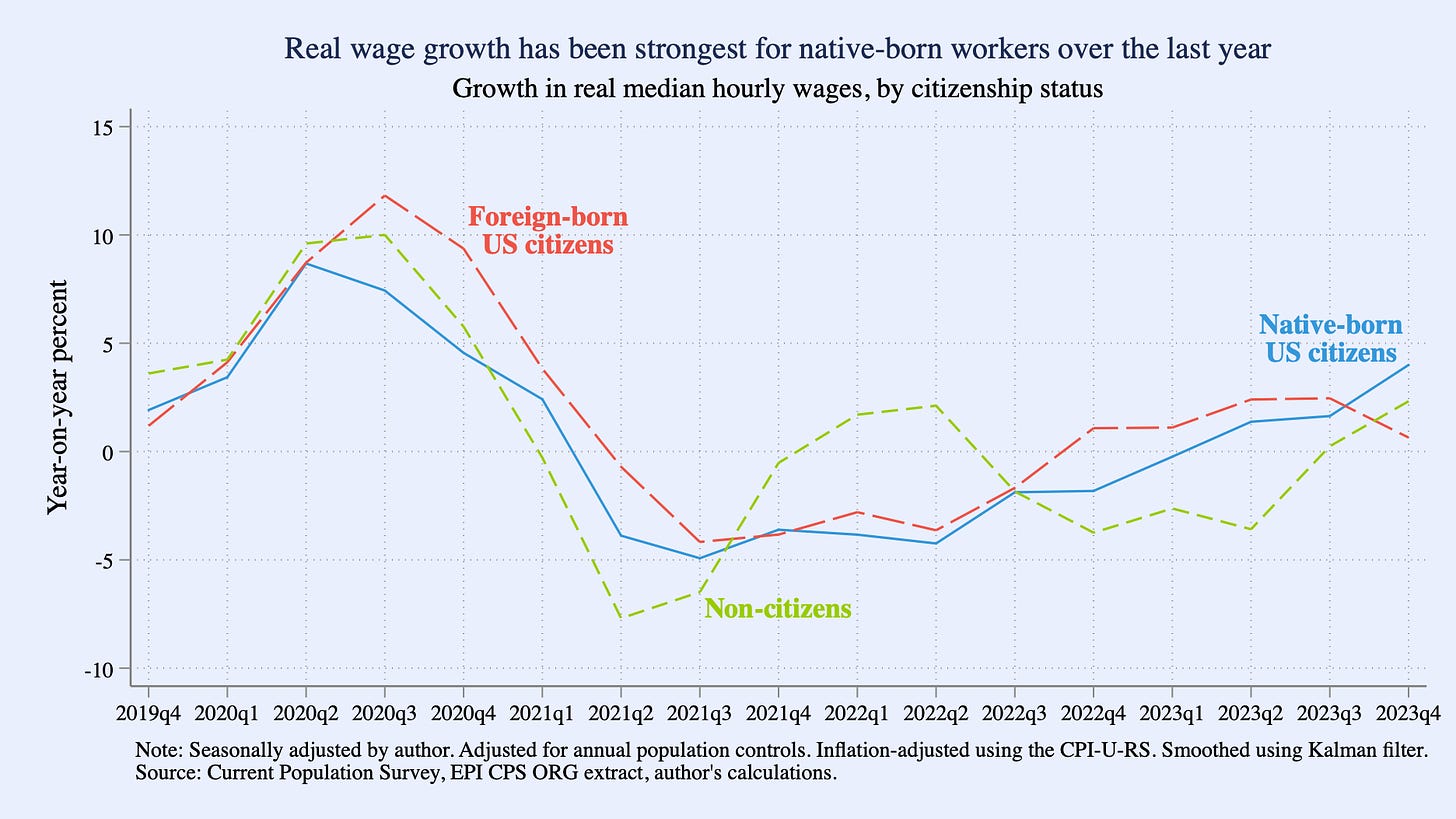
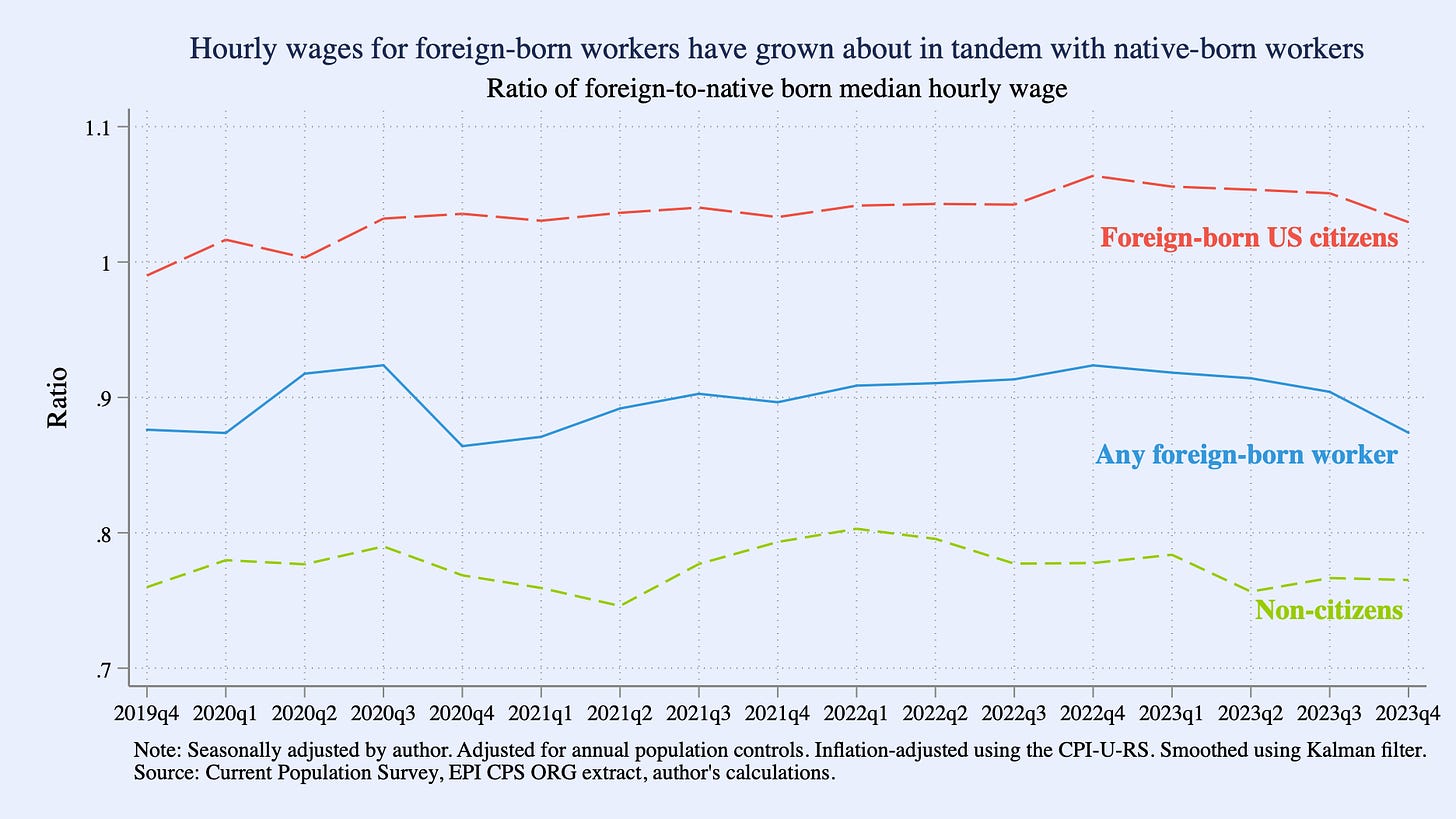
Figure 6 shows growth in real median hourly wages in the CPS by citizenship status,12 while Figure 7 shows the level ratio of foreign-born workers’ wages to native-born wages.13 While wage growth patterns were broadly similar across these populations during the pandemic, they have differed at times: non-citizen real wage growth was positive in early 2022 when it was negative for others, while native-born real wage growth was stronger than the other populations at the end of 2023.
From the standpoint of the growth accounting identity, Figure 7 is the key measure. It shows that the ratio of the typical foreign-born hourly wage to the typical native-born wage ended 2023 at 87%, only slightly lower than the 88% where it ended 2019. Under our assumption that worker productivity growth is proportional to wage growth, that suggests that the relative productivity of foreign-born workers has largely kept pace with native-born workers over the last four years. Most of the productivity effect from immigration then has just been a pure compositional effect: a slightly greater employment share to lower-productivity employment.
Net net, the resulting estimate is that this compositional effect lowered cumulative total economy productivity growth by 0.2 percentage point over 2019 Q4 to 2023 Q4, though this estimate is uncertain in both directions.14
All together, immigrants since 2019 directly account for about one-fifth of America’s extraordinary pandemic growth
Table 1 summarizes the estimates for each component of the accounting identity laid out in Equation 1. In summary, immigration since the pandemic has strongly bolstered US labor supply and employment. The US economy is 8.2% larger in inflation-adjusted terms than just before the pandemic. Of this, 1.6 percentage points–about a fifth of US post-2019 growth–can be accounted for directly by foreign-born workers, illustrated in Figure 9. As mentioned earlier, these direct growth accounting effects are almost certainly lower bounds for the economic effects immigrants have in the long run, given indirect spillovers and the fact that, intergenerationally, the American children of immigrants assimilate quickly and become even stronger economic contributors (NASEM 2017).
Immigration is of course not the sole purview of economics. It touches on a variety of social, moral, and humanitarian issues. But as even this admittedly-incomplete and limited analysis shows, the economics of immigration are consequential. While the short-run effects of immigration can be difficult to identity, economic evidence suggests its long-run effects are broadly and strongly positive, especially across subsequent generations (PWBM 2016). In fact, one compelling rationale for immigration policies viewed as fair, effective, and sustainable by both native- and foreign-born residents alike is to maintain ongoing support for this key ingredient in American prosperity.
APPENDIX: What if immigration has been mismeasured?
The analysis in this report relies on estimates of the civilian adult noninstitutional population from the Current Population Survey (CPS), a joint product of the Census Bureau and the Bureau of Labor Statistics. The analysis makes adjustments to the CPS microdata survey weights to account for annual population controls, but otherwise takes as given the foreign-born population shares implied by the CPS.
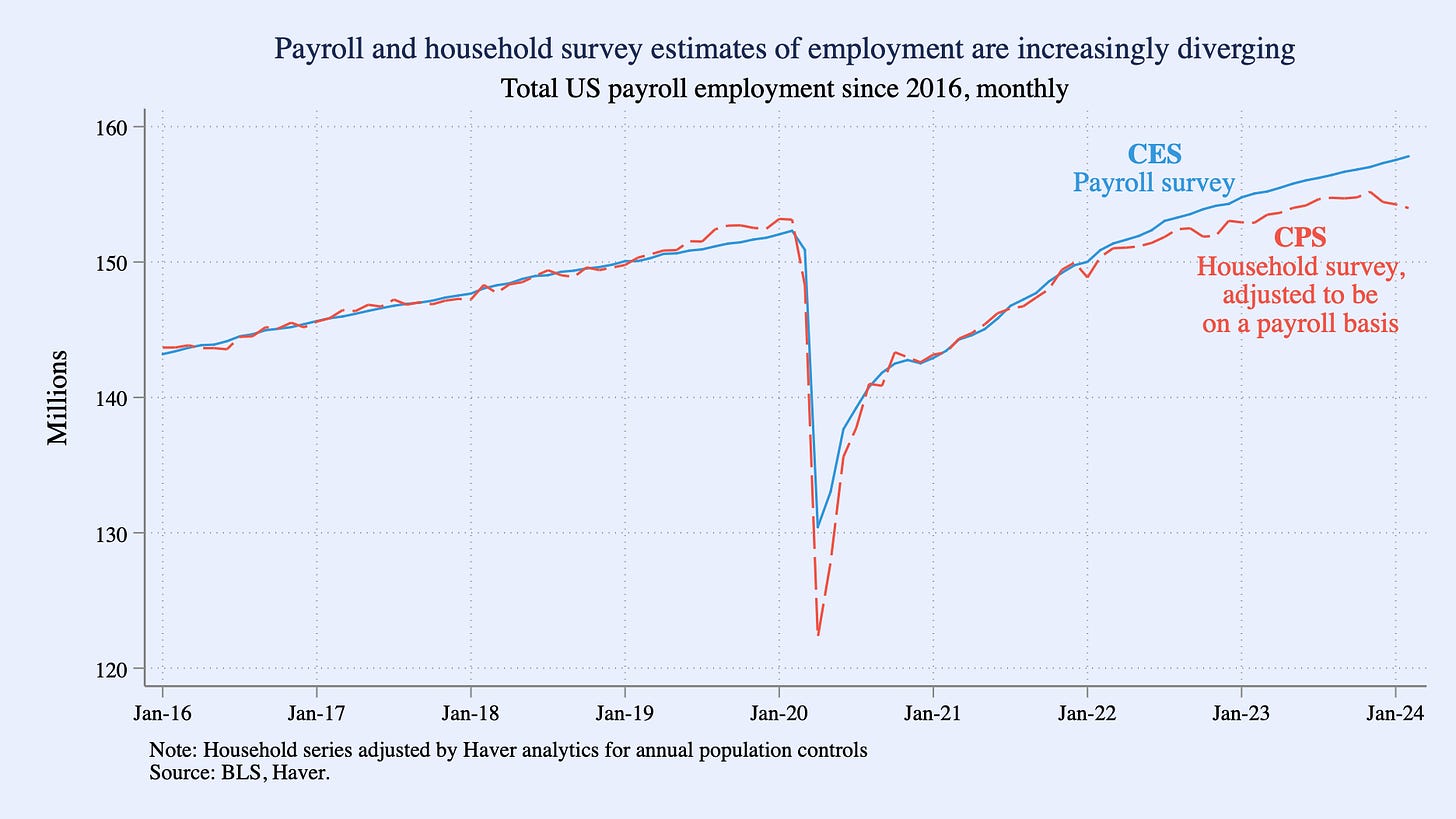
In the last two years, estimates of overall employment from the CPS have diverged from estimates from the Current Employment Statistics (CES), a survey of business establishments with a much larger sample than the CPS, even when the employment concepts are on an apples-to-apples basis (see Appendix Figure 1). Nonfarm payroll employment in the CES was 3.8 million, or 2.5%, higher in February 2024 than the CPS after harmonizing the employment definition in the latter. That 2.5% gap is the highest since the modern incarnation of the CPS began in 1994, other than a short-lived spike in the depths of the pandemic.
The cause of this wedge is an economic and statistical mystery. One possibility is that the CPS is more accurately reflecting recent employment dynamics, and that therefore the CES is overstating the strength of the labor market post-2022. In this scenario, the CES would eventually be adjusted down towards CPS estimates. The CES is revised every year to align it with administrative data from the unemployment insurance system about employment and firm counts. These annual benchmark revisions to the CES can be either positive or negative, and can sometimes be substantial. One issue with this hypothesis however is that CES data through March 2023 has already been re-benchmarked; the gap that month remains a still-large 1.7 million, or 1.1%.
Another possibility is that it is in fact the CPS that is off, understating employment gains, in part because it is undercounting recent immigration. This is a difficult hypothesis to test at the moment. The true size of the immigrant population can be difficult to ascertain. Census uses annual population controls to ensure that the CPS accurately represents the demography of the US, but foreign-born status is not a dimension that Census benchmarks in this process. More detailed data come from the decennial Census, but the next one is not until 2030. Note too that some economists have had the opposite interpretation of recent CPS data; Chicago Fed economists for example argue in a recent blog that the CPS has overcounted immigrants (Butcher et al 2024).
That said, higher-than-expected immigration and the resulting expansion of labor supply would help explain several recent circumstantial macroeconomic surprises, such as the unexpectedly strong US GDP growth and resilient employment growth over 2023 in tandem with cooling inflation. The independent Congressional Budget Office (CBO) revised its demographic projections in January, upgrading its outlook for net immigration through 2026 in part due to a conclusion that the CPS had understated the foreign-born labor share in 2022 and 2023 (CBO 2024a). Largely as a result of these new, higher immigration projections, CBO now assumes $7 trillion more economic output over the next decade than in its prior baseline (CBO 2024b). More recently, over the last three months, CES payroll employment has grown by an average of 265,000 per month. If the CPS were correct about immigration, then the trend payroll growth necessary to keep up with labor force growth would be about 100,000 a month, implying a meaningfully hot labor market. But a recent Hamilton Project piece shows that if CBO’s interpretation of 2022 and 2023 were more accurate, trend payroll growth would instead be closer to 200,000 a month, implying a labor market that is less hot and employment growth that is less surprising (Edelberg & Watson 2024).
CBO concludes that nonresponse in the CPS was likely higher for foreign-born residents than normal Census procedures accounted for. CBO therefore in its demographic projections upweighted foreign-born CPS respondents by half of the aggregate nonresponse rate each month in 2022 and 2023 (e.g. a 30% nonresponse rate would mean CBO adjusted the weights of foreign-born residents by an extra 15%). This assumption would be more than enough to realign CES and CPS estimates of payroll employment. For example, in 2023 Q1, the like-for-like CES-CPS wedge was 1.9 million. I estimate 27 million payroll jobs in the CPS held by foreign-born workers that quarter. That implies that adjusting the CPS weights for foreign-born workers up by 7% would close the CES-CPS wedge that quarter. That is just under half of the adjustment implied by CBO’s methodology.
Note that an upweight to foreign-born workers in the CPS would change both the household employment counts and the payroll employment shares in this analysis. For example, if there were 7% more foreign-born workers in 2022 and 2023 than implied by the household survey, Figure 4 would show growth of 600,000 payroll jobs for native-born workers since 2019 Q4 (rather than 2.2 million) and 8 million more since 2020 Q4 (instead of 9.6 million.
Figure 1 shows cumulative core HICP inflation. “Core” is defined as excluding fresh food and energy, omitting the primary channels by which the war in Ukraine has affected prices in Europe, which would otherwise skew global pandemic inflation comparisons. HICP inflation is a harmonized concept that allows apples-to-apples international comparisons of inflation, but it differs from official US CPI and PCE inflation in important ways. HICP is most appropriate for the US in the context of such global comparisons. See White House Council of Economic Advisers (2023) for more details.
Official productivity measures are typically expressed on a per hour basis rather than per worker. For simplicity and because hours are often less reliably measured than employment, I omit the hours margin in Equation 1. This simplification just combines the per-hour productivity and average hours worked margins (Y/H * H/E) into a single per-worker productivity margin (Y/E), and does not affect the exercise’s final total contribution of growth from immigrants.
The labor force statistics quoted in this piece are adjusted for annual Current Population Survey (CPS) population controls and therefore differ from official figures published by Census and the Bureau of Labor Statistics (BLS) from the CPS, which do not make such adjustments. We backcast annual population controls by age-sex categories in a similar vein to Bauer et al (2023): non-decennial Census controls (e.g. 2021 and 2023) are backcast 12 months, while the decennial controls implemented in 2022 are backcast 10 years. See the Appendix for a more speculative discussion about CPS counts of foreign-born residents.
Per capita economic growth is less affected by immigration in the short-run and may even be temporarily lower, depending on the types of immigrants arriving. It is important to recognize however that a negative effect on average per capita growth is almost entirely a compositional effect, not a reflection of actual changes to well-being for the typical native-born worker. This same caution extends to interpretations of average productivity, as discussed later in this piece.
The CPS asks respondents about their citizenship status, but not their legal status. Therefore the non-citizen category will include both foreign-born workers authorized to work in the United States (such as green card holders, H-1B visa holders, and temporary parolees authorized to work) and those without authorization.
The two most common employment concepts cited in the US context are household employment and payroll employment. The two metrics often track one another but can deviate substantially due to definitional and survey differences. Household employment is on a per-worker basis and comes from the CPS, which is a survey fielded to households. It is a broad definition of employment that includes agricultural workers, the self-employed, and other sectors excluded by payroll employment. Payroll employment measures number of jobs, not workers, and only counts wage and salary workers in nonfarm industries. However, payroll employment is calculated from a different survey–the Current Employment Statistics (CES)–which is fielded to firms and has a significantly larger sample than the CPS, making payroll employment less volatile than household employment month-to-month.
This analysis uses household employment as the employment concept for the purposes of the growth decomposition since it is a broader, total economy concept, but this section also analyzes payroll employment since it is a closely-followed metric.
The CES does not decompose payroll employment by citizenship status. Figure 4 therefore uses the CPS to estimate payroll employment shares for these populations and then applies them to published statistics on CES payroll employment. The analysis uses a similar approach to BLS’s series on payroll-basis household employment: it starts with CPS household employment and then excludes sectors and workers outside the scope of nonfarm payroll employment, while also upweighting multiple job holders.The foreign-born share of this adjusted CPS employment measure is what is applied to the CES.
See the Appendix for more discussion about possible mismeasurement of foreign-born residents in the CPS.
This rise is almost entirely due to a substantial expansion in their participation rates: the employment-to-population ratio for non-citizens was down slightly by 0.1 percentage point, but their labor force participation rate was up by 1.3 percentage points.
The change in (1 - the foreign-born unemployment rate) between 2019 Q4 and 2023 Q4, weighted by the 2019 Q4 foreign-born labor force share of 17%. Or:
((100-3.9)/(100-3.1)-1)*(0.17)
That said, healthy skepticism of this assumption is warranted. There are reasons why productivity may not strictly follow wage growth, especially over short periods of time. Changes in capital quality unrelated to labor may affect productivity. Certain factors may also drive a wedge between wages and productivity for immigrant workers specifically, such as discrimination and employer visa lock-in.
The wage series shown is “wageotc” from the Economic Policy Institute’s excellent CPS microdata extract.
Only ¼ of the CPS sample is eligible for wage data every month, causing even quarterly medians to be noisy and difficult to interpret. Therefore for the wage analysis we use a simple Kalman filter to exclude typical volatility.
Actual total economy productivity (real GDP per household employment worker) grew by 6.9% between 2019 Q4 and 2023 Q4. I decompose the average level of productivity between native- and foreign-born workers using household employment shares and the median wage ratio depicted in Figure 7. If the decomposed average native-born and foreign-born productivities had grown in line with actual history, but the number of foreign-born workers stayed constant at 2019 Q4 levels, total economy productivity would have instead grown by 7.1% over this period. The difference between the actual data and this counterfactual is -0.2 percentage point.


