


Highway investment probably didn’t go up under Biden – this matters for future policy design
Data sources vary, but the most relevant data source suggests that highway spending, adjusted for inflation, declined. If true, we should rethink federal infrastructure funding in times of distress.


An important debate is raging about whether real highway spending declined under Biden. Jason Furman says yes. Ernie Tedeschi and Eric Van Nostrand point out that different standard data sources say different things. This matters because we want to know how much we are getting for our infrastructure dollars (a major long-term issue in the US). It matters for the legacy of President Biden. Maybe most importantly, while highway spending is just a slice of Biden-era infrastructure spending, it matters for how to design future infrastructure spending programs, with the goals of either economic stimulus or producing more infrastructure investment.
Has U.S. infrastructure investment really declined?

Last week in Foreign Affairs, Obama Administration CEA Chair Jason Furman argued that real investment in U.S. infrastructure has fallen since the pandemic. This is a provocative claim: increasing infrastructure investment was a significant focus of the Biden Administration, especially via the 2021 Bipartisan Infrastructur…
Here’s my take: All are making useful contributions. But, while I find the results difficult to fully explain, my best guess is that real highway spending fared poorly because I’m most inclined to believe the price data that Jason uses, which is based on actual bids for highway projects, is most relevant.
Much to my surprise, I have now been working with highway spending data for almost a decade, as I have tried to understand the big drivers of high US infrastructure costs (too little state capacity and competition, citizen voice, state capacity again, environmental permitting, differences in Interstate costs across states). So let me try to glean from that experience what to make of the available data.
My friends (and former Biden Administration colleagues) Ernie and Eric make two claims: First, when you adjust for inflation using input price data series (e.g., using the price of asphalt) instead of the prices charged in the bids for highway projects, real highway spending goes up, rather than down. Second, when you look at actual new miles of highway, 2022-2024 looks like a period of relatively fast growth by recent standards. For the first claim, we can’t say for sure what’s the better series, but I’m much more inclined to believe the bid price data - because that’s what was actually charged in practice. For the second claim, I’m quite skeptical of the underlying data, so I don’t think that it sheds much light on these issues. Highway mileage data is complicated by year-to-year changes in what is categorized as a highway – the data often show an increase in mileage, even if there’s no new asphalt on the ground.
Data Series Assembled by Tedeschi and Van Nostrand

How highway contracting works
I first want to describe how highway contracting typically works. A state highway department decides that it wants to resurface a given portion of highway. It estimates (see the example below) that the project will take 5 tons of asphalt binder, 1,472 tons of mineral aggregate, 506 gallons of tack coating, etc. Bidders say how much they’ll charge for each item, including labor (which is not a separate item). Their total bid is the estimated quantity of each item times the price of each quantity in the bid. Then, the bidder with the lowest sum total typically wins. If a project ends up using more or less of a given item, the price for that item is the price in the initial bid (including labor).

I didn’t choose repaving as a purely random example here: a huge amount of highway spending is for maintenance—for example, 72% in 2014 (the most recent data I’ve collected).
The NHCCI bidding price index is best because it reflects the prices actually paid
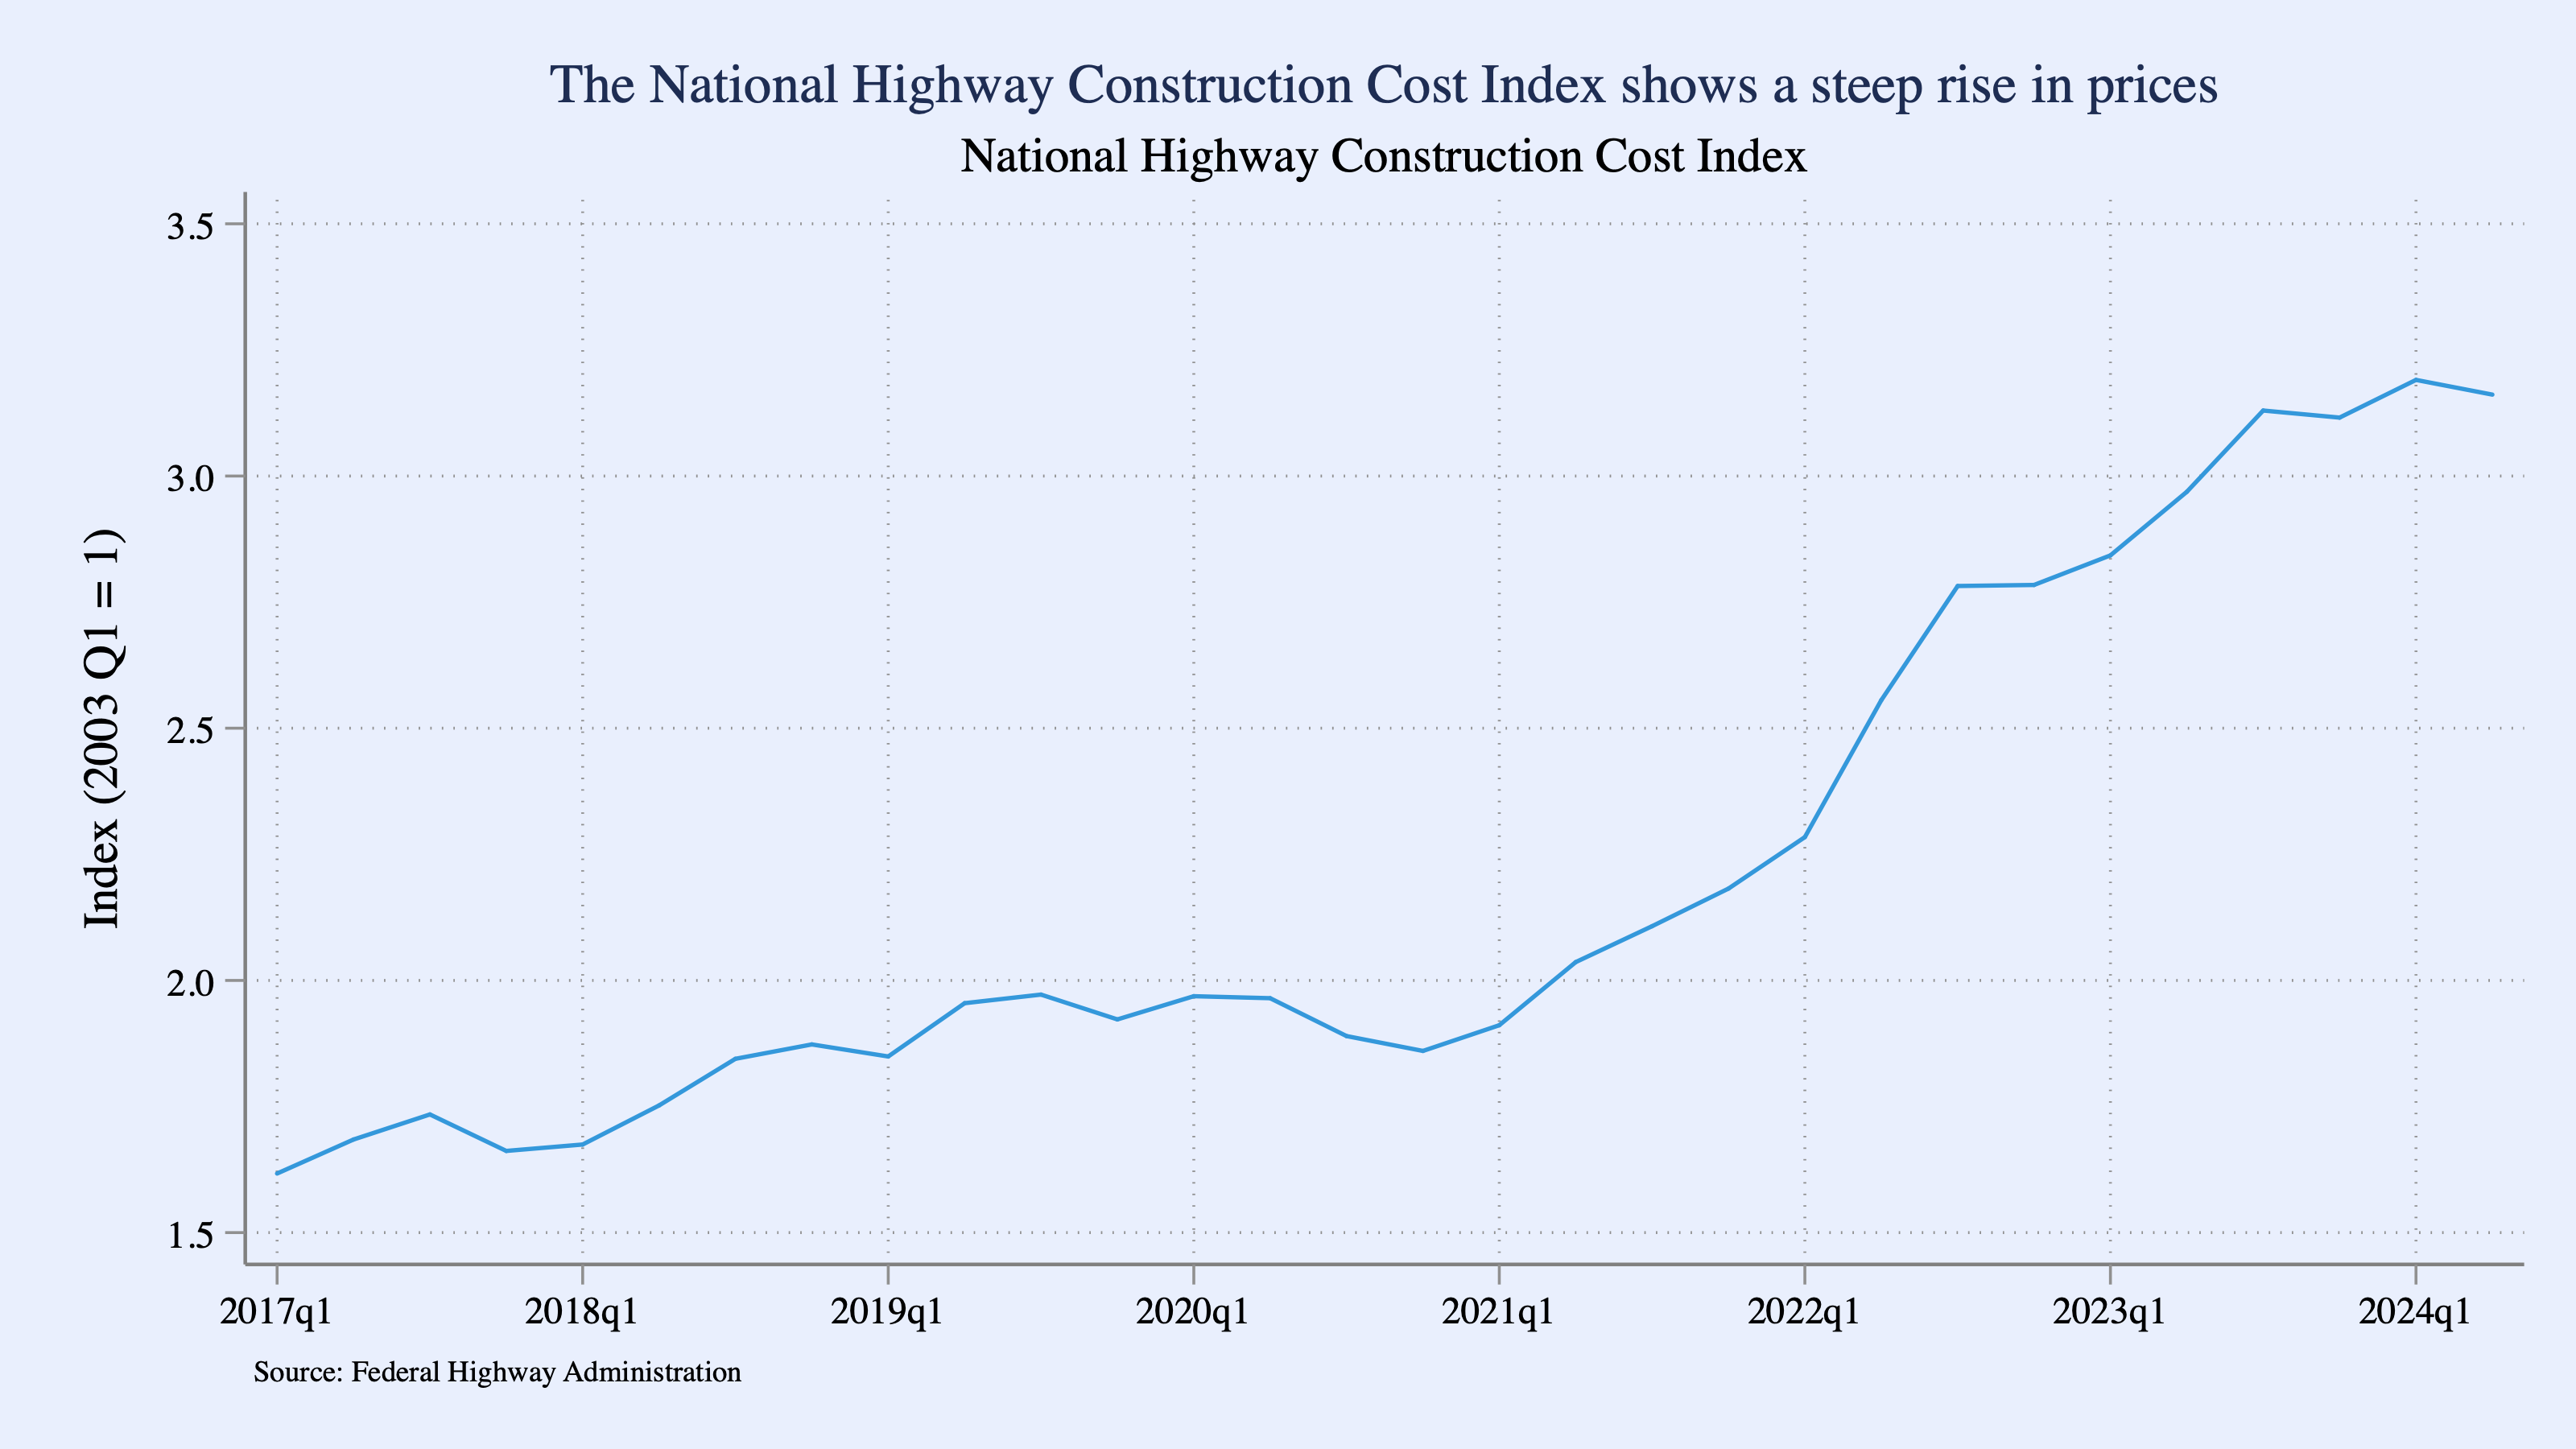
The deflator that Jason uses, the National Highway Construction Cost Index (NHCCI), takes the actual prices for specific items in the bids and tracks them over time. The other measures that Ernie and Eric use track materials and labor input prices that are used for highways, but not the actual bids.
The main reason that I’m inclined to think that the NHCCI is the best measure is exactly this: It is, by design, the price that governments are paying for the things they are actually building. Using the data series produced by the major statistical agencies, as Ernie and Eric do, is a good default – those agencies have tremendous expertise, but I think that the NHCCI is fit for purpose here. (Note as well that subsequent to his initial publication, Jason has noted that other data series, from the Office of Management and Budget, the BEA itself, and the Congressional Budget Office, show real declines in highway spending, though typically by less than NHCCI does. I’ll focus on NHCCI here though.)
Ernie and Eric point out that final total costs might be different from the bids, but that is unlikely to be an issue for three reasons. First and most importantly, what the NHCCI is tracking is the prices. Final costs might be higher or lower than the bid, but that would typically be because a higher or lower quantity of goods (with associated labor) were used. Second, in any case, cost overruns just aren’t that big on these projects. Though information on the cost overrun of highway projects is limited, the median cost overrun for all California DOT projects, 2000-2023, was 7.7%, based on my paper with Cailin Slattery and Will Nober. Third, Ernie and Eric suggest that the NHCCI could have the wrong weighting for labor costs given cost overruns. However, the materials prices in the NHCCI are labor-inclusive. Overruns happen by consuming more or less of an item, including the labor associated with it, so I’m not sure how it could have the wrong weight on labor: the price in the NHCCI is the price that the state DOTs pay.
Now, we don’t want to be naïve here. We know that, to some extent, bidders game the system. For example, they bid low on items when they think lower quantities will be used and they bid high on items when they think higher quantities will be used, which will contribute to cost overruns. But there’s not much reason to think that gaming went up over this period, especially in a way that impacted the relationship between estimated prices and final costs. It would be surprising if state DOTs suddenly started doing a bad job of estimating the necessary item quantities for standardized projects.
The results are surprising, but this might be what happens when lots of money chases a limited supply of highway-builders
So why would the other indices that Ernie and Eric use be different? I don’t know for sure. However, what matters for builders of highways isn’t the price of inputs out there in the economy, but rather the price that they’re charged. Remember, the price that they’re charged includes labor, so this price could be impacted by spiking demand for highway contractors, who have a pretty fixed supply in the short-run (they are capital-intensive and pretty skilled, see picture of milling and repaving machines below). And, this is exactly what the NHCCI covers – the bid prices that include labor. In contrast, other series look at all construction labor, rather than those in this quite narrow sector. And they don’t look at the prices actually paid by state DOTs.

I don’t know for sure, but this might be part why USDOT developed this index, rather than relying on others like BEA. In any case, we talked about prices for building highways inside the government when I was Chief Economist at the Office of Management and Budget in 2022-2023, and we used the NHCCI.
One possible way to reconcile the two data series is that highway construction firms’ markups went up. As Nober, Slattery, and I document, there is remarkably little competition for these bids. So it is possible that firms increased the prices they charged state DOTs more than enough to make up for the increase in input prices. Another way to think about it begins with the fact that the inputs tracked by BEA might be used in many places. (Parking lots and driveways need to be repaved too.) Highway contractors suddenly faced an increase in demand because of funding from the Bipartisan Infrastructure Law (and flush state and local government budgets owing in part to the American Rescue Plan). It was hard to expand supply quickly—they couldn’t suddenly have more machines, and state government procurement rules are challenging, creating significant barriers to firm entry. (To our astonishment, the paperwork to submit a bid for a basic repaving project is often hundreds of pages long, making it hard to enter the market.) So, with a rather fixed supply for the service of highway repaving, costs for highway provision can go up a lot without the underlying input prices going up. You could think of it as an increase in the returns to the firms’ physical and organizational capital, which is not tracked by the BEA materials and labor data series.
And indeed another reason that I’m inclined to trust the NHCCI is that, when I talked to people in state departments of transportation, they said that they were shocked at how high bids were coming in, often eating up all the extra money that they were getting.
None of this is to say that the results using the NHCCI aren’t very surprising. The supply of construction equipment – and maybe also labor - is pretty fixed in the short-run. And maybe there were supply chain issues (though were there really issues for the major highway inputs?). So that could explain why there wouldn’t be much of an expansion of output. But it doesn’t do much to explain a contraction. So, I regard this decline as a mystery, even as—on pure grounds of what data I most trust—I’m inclined to believe the NHCCI.
I’m not aware of new Biden-era rules that could explain the price increase either. There may have been sins of omission: BIL made only modest reforms to permitting and didn’t do much to change rules on procurement or otherwise to make it less expensive or quicker to build. But there wasn’t much that directly made it more expensive to build – and, in any case, many such efficiency improvements that would have mattered for our major long-term infrastructure cost issues, but may not have done much in the short term, especially on simpler projects like highway repaving. Some have pointed to the new made-in-America rules, which went into effect in November 2022. And some state DOT officials expressed concern about them. But my understanding is that the new rules didn’t cover concrete, cement, or aggregates (e.g., gravel), and iron and steel had always been covered. Also highway prices were shooting up well before November 2022. So I doubt that the new made-in-America rules explain much of the rise in the cost of building highways.
This all raises a meta-issue: Should I believe sources on the basis of their methodology or their results? Typically good science suggests that we should follow methodology, but sometimes the results just smell bad, which could provide useful evidence (with the obvious problem that doing so would allow people to just choose the results that they like). These results are odd, but I incline toward focusing on the methodology, so I’m still left thinking that the NHCCI is the best guess, even as I acknowledge that I’m not at all sure.
One final note on deflator series: I have been presuming that the measurement goal here is knowing the amount of pavement on the ground, the change in real investment. One might have other goals. For example, one might want to measure the amount of money used for highways with a goal of knowing how much that contributed to economic stimulus. For that, what matters is much more how much cash went into the pockets of highway firms and employees—and for which the input prices paid by the firms and overall consumer prices paid by employees would matter most. So, if that is the question, rather than the quantity of new investment, the other data series could very well be closer to being the right ones.
If, though, the goal is real investment and the NHCCI is correct, the implications are substantial for things as basic as measuring real GDP growth. The data Ernie and Eric use are what is used for translating highway spending into the real highway investment component of GDP. (They’re not bringing in some random data series; they’re using very standard ones.) So if the NHCCI is right, then the official GDP statistics have made an error in real GDP accounting over the last handful of years.
It is hard to take much away from noisy data on miles of highway built
The second major claim that Ernie and Eric make is that, when you look at the actual miles of highway built, 2022-2024 seem to have strong infrastructure output. They carefully acknowledge that this measurement has issues. I nevertheless find their measurement of highway mileage problematic (so much that I don't think that it's helpful) for two reasons.
Tedeschi and Van Nostrand analysis of highway miles added

The second major claim that Ernie and Eric make is that, when you look at the actual miles of highway built, 2022-2024 seem to have strong infrastructure output. They carefully acknowledge that this measurement has issues. I nevertheless find their measurement of highway mileage problematic (so much that I don't think that it's helpful) for two reasons.
First, as I learned with Leah Brooks when we studied the cost of building the Interstate highways over time, comparing year-to-year highway length totals is typically not a good idea. The signal is small relative to the noise: We add a small number of miles each year, but there are much larger movements in what's categorized as a highway, up and down. (In the project with Leah, we were trying to measure how much mileage increased each year as the Interstates were built, but we found that total counted mileage kept decreasing! That was bad for us – we had to collect different data on when highways were built.) You can see how noisy the OpenStreetMap data are, with the big drop in 2020. We didn’t blow up a bunch of highways that year. Rather, they were probably just recategorized (a possibility Ernie and Eric note). So, there's not much reason to think we get a lot of value from these numbers.
Less importantly, pointing out that major highway miles increased more in 2022-24 than in the years before the pandemic is a bad grouping of years, because new highway miles in 2022 had almost nothing to do with the Bipartisan Infrastructure Law or anything Biden did. Building a new mile of highway is a huge deal and takes years to plan. I get that the question here is real spending during the Biden Administration, but this is nevertheless a little misleading. (In any case, as I noted, most highway spending is actually on maintenance. That could respond more quickly.)
If real highway spending fell, future highway aid should consider the macroeconomic context
I could be persuaded otherwise on almost anything I said here. For example, maybe there’s some time-varying issue with the NHCCI. Or, notwithstanding the drop in highway mileage in 2020, maybe highway mileage data somehow don’t suffer from the problems I laid out.
In any case, Ernie and Eric did a big service in pointing out how different outcomes look with these other data series (which is not surprising – I’ve learned a lot from them over the years). Hopefully their analysis will spur folks to dig deeper to understand what’s really going on here.
But my best guess is that real highway spending didn’t go up by much, or perhaps it even fell, during the Biden years.
The stakes of the debate are big. If real highway spending didn’t increase by much or even declined (a big if!), this fact would have implications for infrastructure spending in future times of distress. One story of what happened here is that, when the Bipartisan Infrastructure Bill (BIL), which increased highway spending, was signed by President Biden on November 15, 2021, states were pretty flush with cash from a reasonably strong economy and funding from the American Rescue Plan. The economy was tight; the most recent inflation report (from September) said that prices had gone up 5.4% from the year before, and unemployment was down to 4.8% and dropping. BIL then increased funding further, with much of the increase in still-to-be-delivered long-term (often non-highway) projects, but a decent amount for shorter-term highway projects. Over the short run, machines like the ones pictured above are in pretty short supply. It was hard to expand output much. Instead prices shot up as more money chased a pretty fixed supply. Notably, if you eyeball the NHCCI, it is the second quarter of 2022 when price increases really accelerated.
The situation would be totally different with stressed states and a weak economy, as was the case in 2009 after the Global Financial Crisis; the demand for highway work would be weak and more funding could help deploy underutilized resources.
Next time Congress considers its infrastructure spending (likely in the major every-five-year surface transportation bill reauthorization in 2026), it could think about the macroeconomy more. For example, it could allow states to postpone spending to future years if market conditions are poor. Or it could enact triggers that ramp down spending (or at least ramp up more slowly) when more spending will tend to drive up prices as projects compete for limited resources – and ramp up spending when inflation is low and the unemployment rate is high. That would result in more infrastructure delivered to the American people.
 | A guest post by
|
Hey Zachary—first of all, great work in this piece! I have really been enjoying the back-and-forth between Jason, Ernie, Eric, and you on this issue. I tend to lean towards the view that BIF managed to cause an increase in real roadway spending relative to counterfactuals, but trust the BEA numbers most and so think we hadn't exceed 2019 construction activity by 2023 and will only achieve that in 2024.
One thing that I haven't heard anyone discuss is the employment figures*—roadway construction employment is up 23k, or ~6%, from 2019 levels to new record highs, which is part of the reason I think investment likely increased. Curious to see what your take on this is?
https://data.bls.gov/dataViewer/view/timeseries/CES2023730001;jsessionid=6D47E2FDC9FCA799429F8D7B25017C7E