


Has U.S. infrastructure investment really declined?
The devil is in the deflator, and most deflators show it has risen since 2019


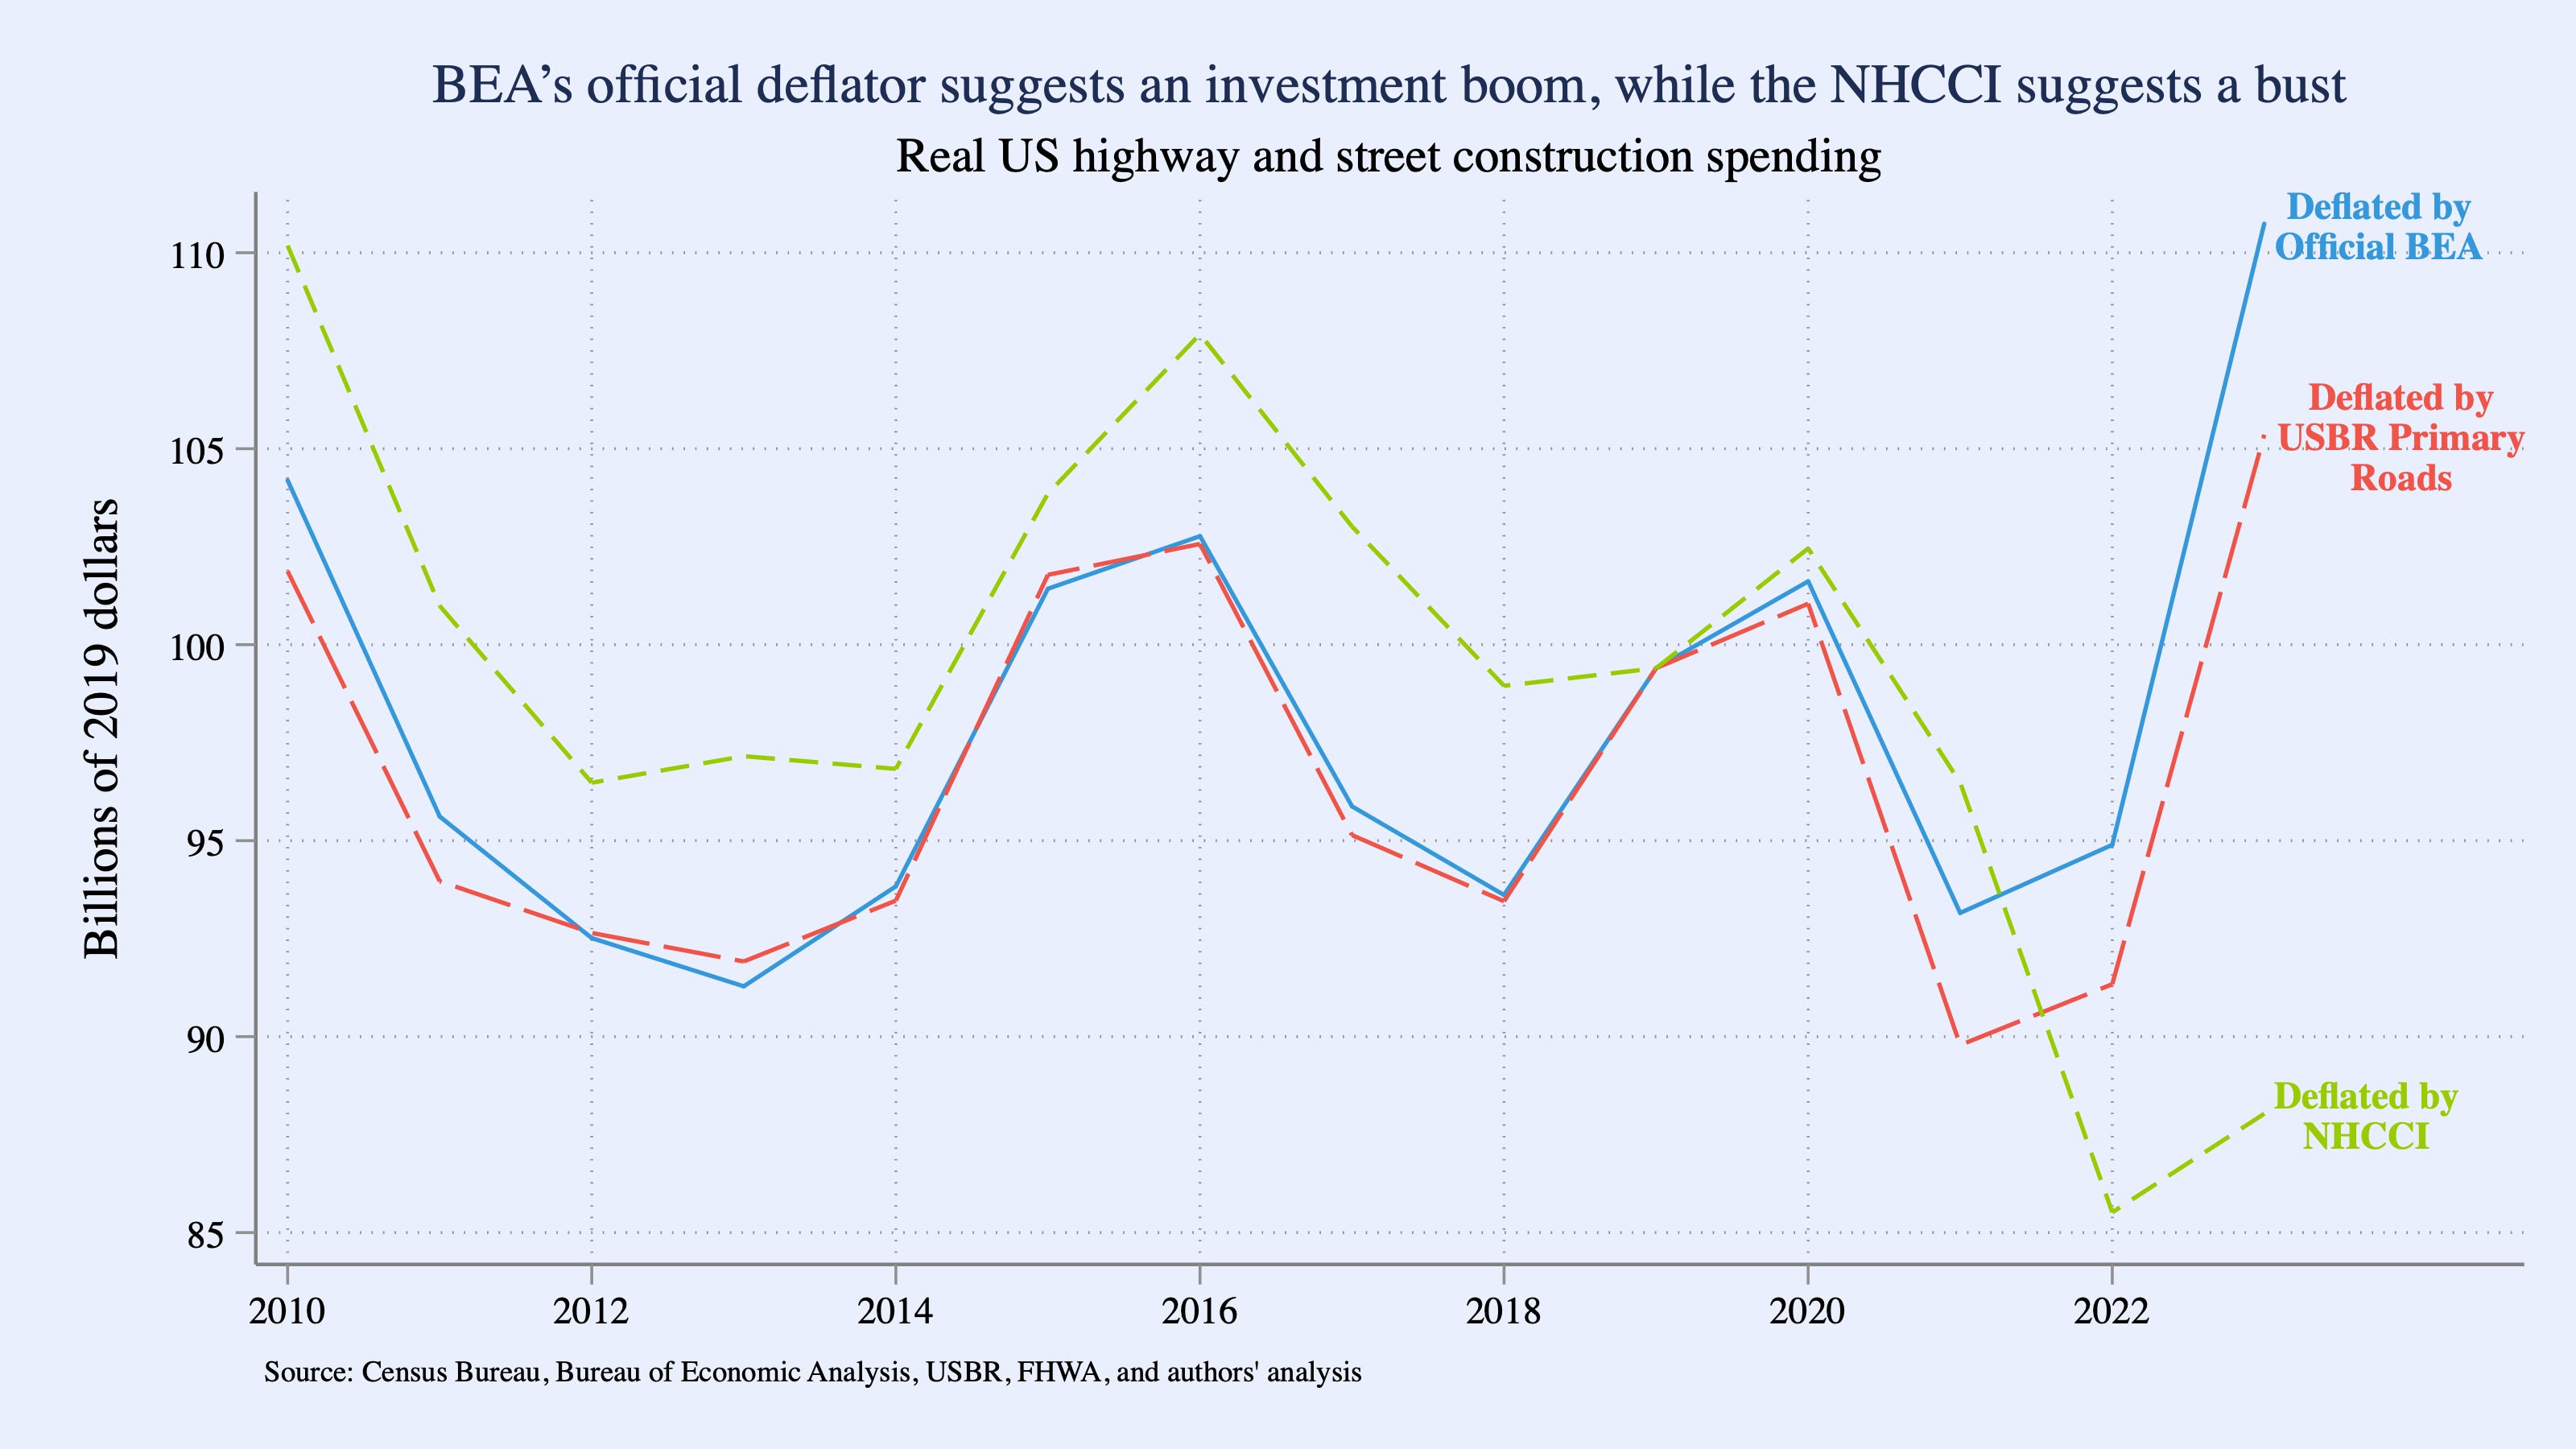
Last week in Foreign Affairs, Obama Administration CEA Chair Jason Furman argued that real investment in U.S. infrastructure has fallen since the pandemic. This is a provocative claim: increasing infrastructure investment was a significant focus of the Biden Administration, especially via the 2021 Bipartisan Infrastructure Law (BIL). Here, we explore the analytics behind measuring real infrastructure, focusing on the highway and street construction data that Professor Furman emphasized. The details matter: whether real infrastructure investment rose significantly or fell turns on the specific price index used to adjust for inflation. We find that using the official price index that the Bureau of Economic Analysis (BEA) uses to deflate these data, real highway spending has risen 11 percent since 2019. Professor Furman’s claim that it has fallen depends on using something different, the National Highway Construction Cost Index (NHCCI). The NHCCI is an outlier relative to other measures of highway spending costs. It has shown much more inflation than the official price index, therefore showing less real investment than BEA’s official published series. We also explore non-spending measures of real infrastructure, including miles of highway measured by the Federal Highway Administration and inferred from OpenStreetMap. These measures both show an increase in highway construction since the BIL was passed.
How should we measure real investment?
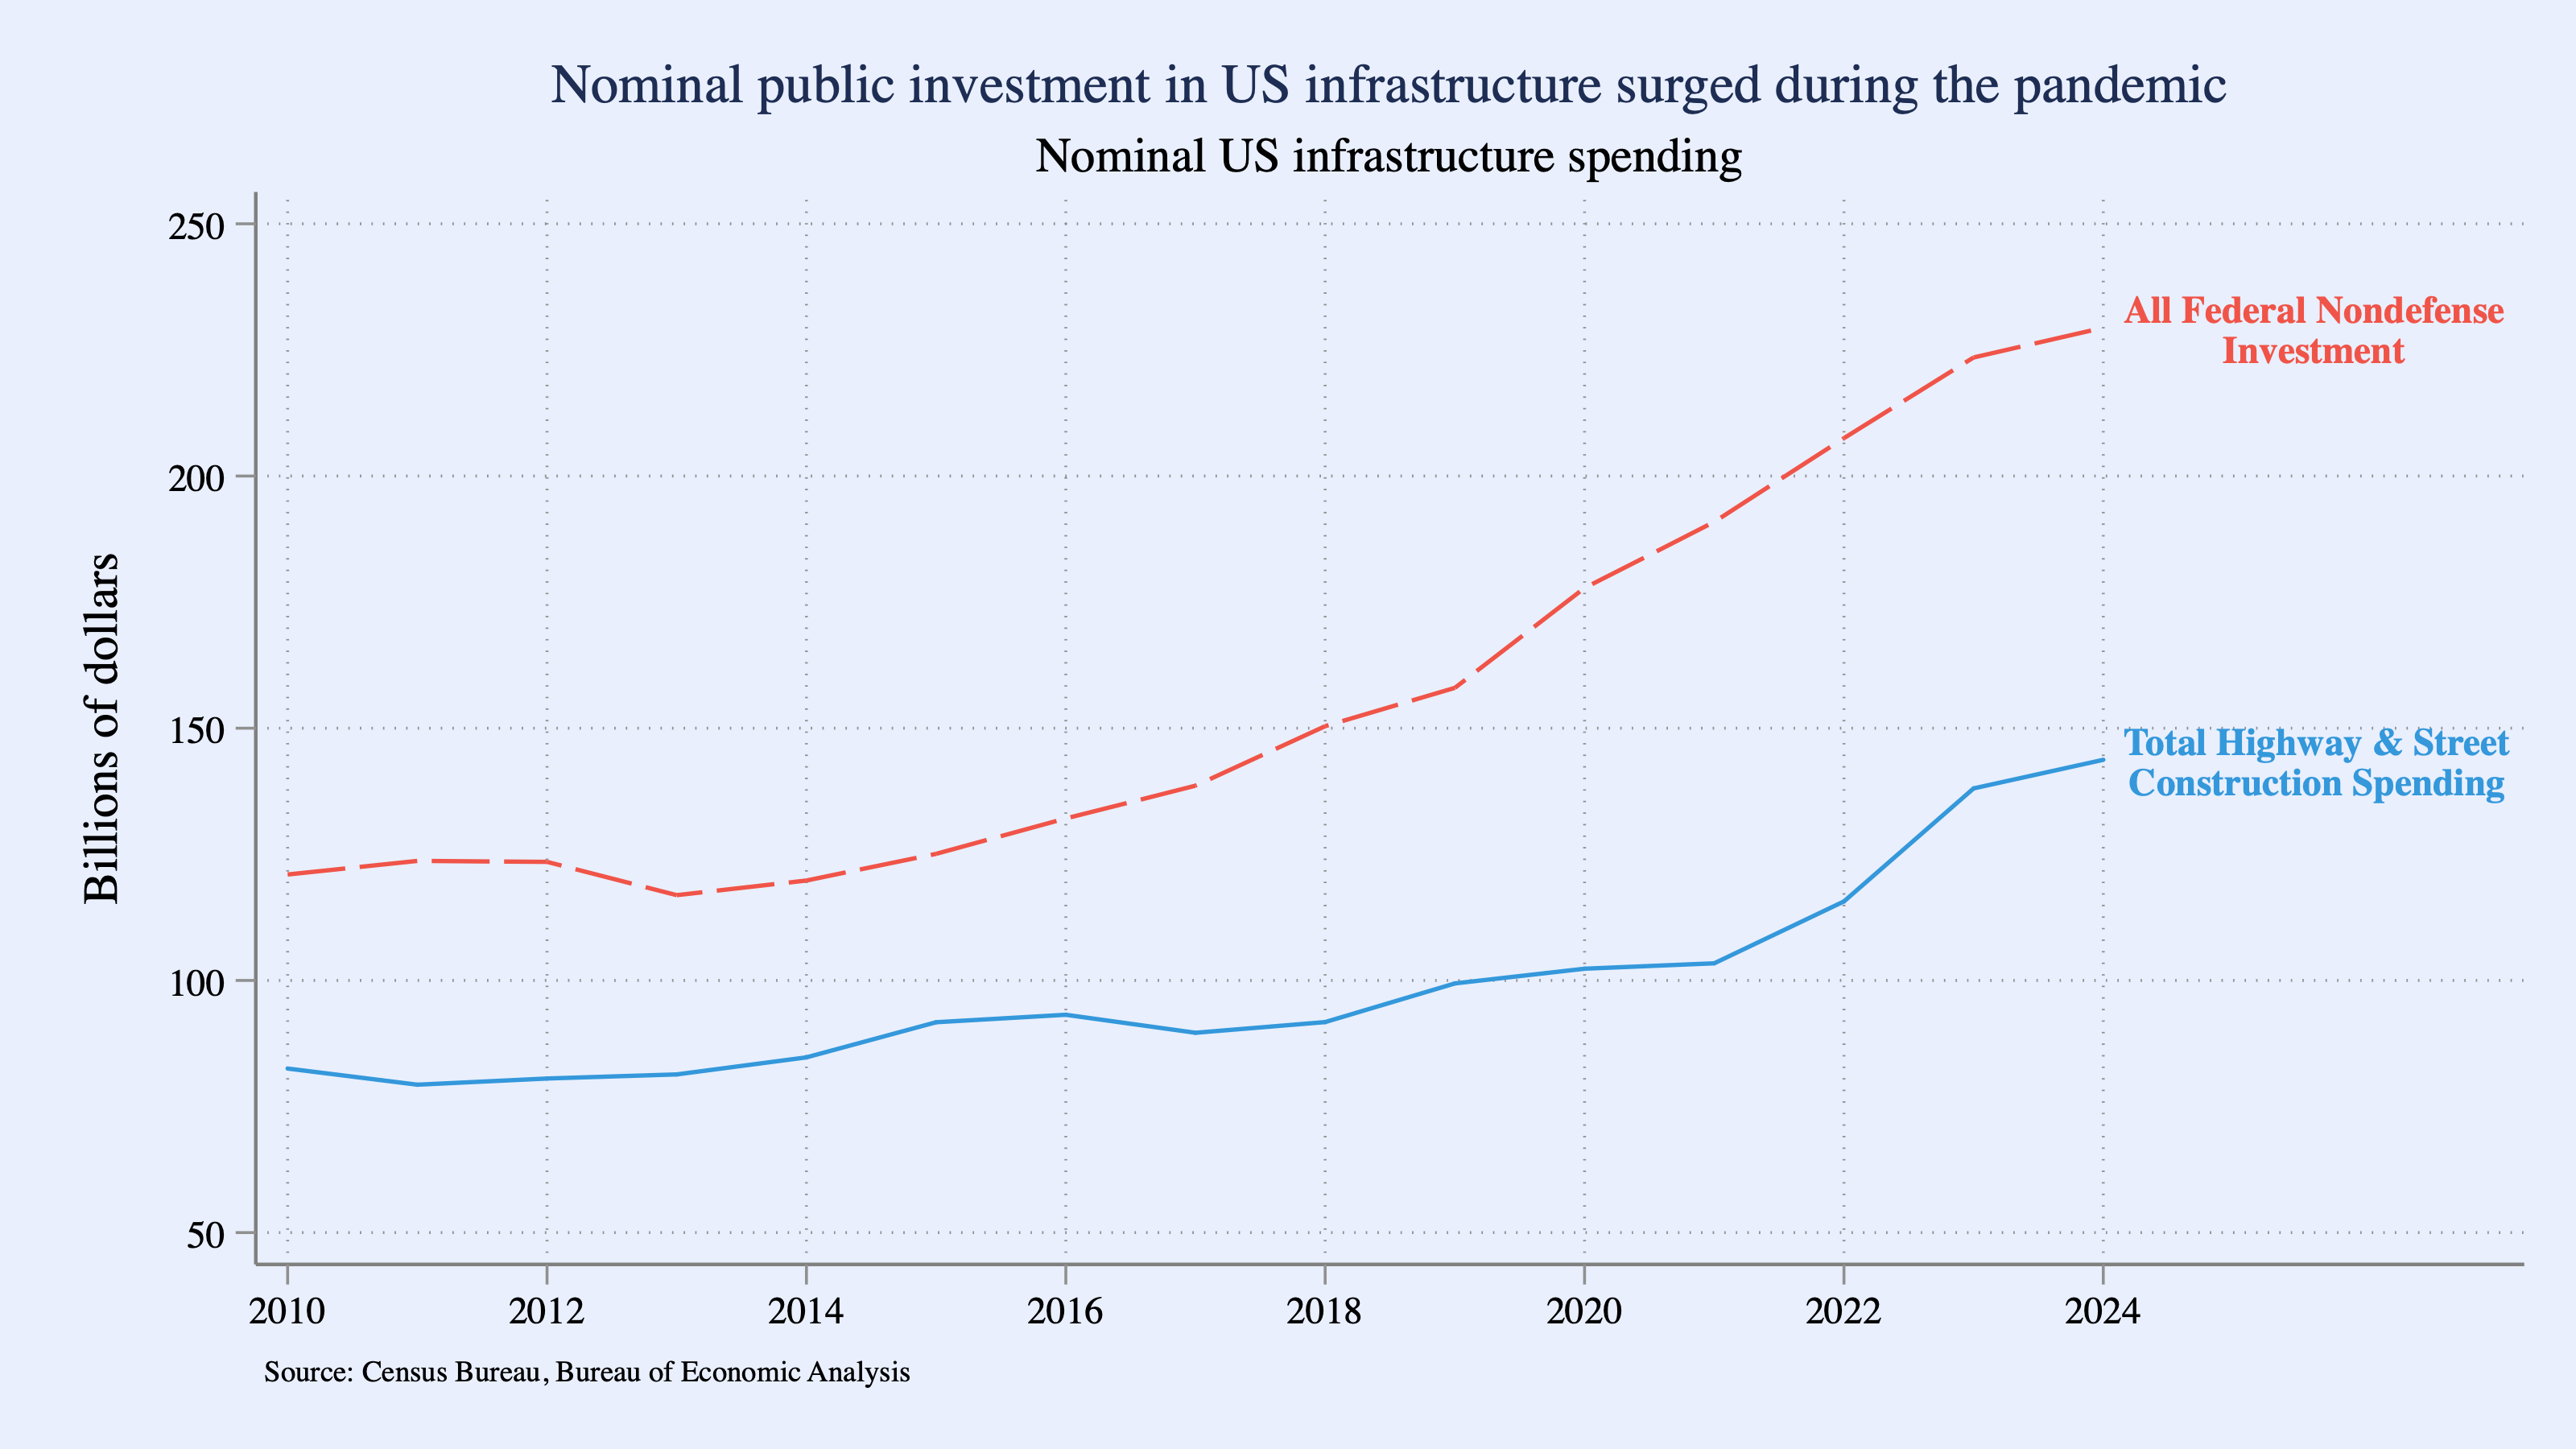
Everyone agrees that nominal infrastructure spending has risen in the United States since before the pandemic. We focus first on highway and street construction, a dominant component of U.S. infrastructure funding and the component on which Professor Furman bases his argument. Total highway and street construction spending at all levels of government—federal, state, and local—grew by $39 billion, or 39%, between 2019 and 2023, reaching $138 billion (see chart below). Nearly this entire increase occurred after 2020. Roughly half of this spending is accounted for by direct federal highway spending, federal-aid highway grants, or state matching funds for federal highway projects. If we ignore state & local infrastructure spending for a moment but look at a broader measure of all federal nondefense investment (including in non-highway infrastructure like mass transit and energy transmission), the increase is even larger in nominal terms: federal nondefense infrastructure spending rose to $224 billion in 2023.
However, everyone also agrees that the increase in costs since the pandemic has dampened the impact of that sharp increase in nominal infrastructure spending. The key question is whether real, or inflation-adjusted, infrastructure spending has risen: in other words, whether the increase in nominal spending was sufficient to overcome the increase in costs and leading to more miles of road or higher-capacity power lines. Real spending is ultimately a way of tallying up whether the quantity of actual infrastructure investment—independent of price—has risen or fallen. The “dollars” in a real investment calculation are just a convenient, apples-to-apples way of adding together otherwise incompatible units of quantity. If I build 500 lane-miles of highway and 10 hydroelectric power plants one year, and 1,000 lane-miles of highway and 7 hydroelectric power plants the next, has the quantity of investment increased or decreased? It’s hard to say at first glance since it’s not obvious how one would combine “lane-miles of highway” and “number of hydroelectric power plants” in a compatible and understandable way. But by taking the dollar cost of both in a common base year and then inflation-adjusting for any cost changes before or after that base year, we can track the total quantity of all investment over time using shared units of measurement between all types of investment; in this case, constant dollars in whichever base year we choose.1
The devil’s in the deflator
To figure out how much real highway and street spending changed, we need a price deflator that reflects the underlying costs of road construction. There are a few valid candidates. Importantly, the answer to the key question of whether real infrastructure has risen or fallen turns on this choice. Therefore, it is critical to closely understand the differences between those candidate deflators.
The Federal Highway Administration produces a metric called the National Highway Construction Cost Index (NHCCI), which Professor Furman relies upon to argue that real infrastructure investment has fallen. The NHCCI measures the average change in prices that State transportation departments pay for the materials and services that go into roadway construction. It is constructed from State web-postings of winning bids for highway construction projects. In theory, then, the NHCCI should also reflect both materials and labor costs. But the bids underlying the NHCCI do not always reflect final costs. And as we unpack shortly, other candidate deflators have grown somewhat between what canonical measures of materials costs and labor costs have done. The NHCCI, however, has grown much faster than either one.
The Bureau of Economic Analysis (BEA) publishes a different price index used to calculate real highway spending for the purposes of GDP accounting, which is important since highway investment counts as a part of GDP. The BEA uses this price index to adjust the same nominal highway spending data on which Professor Furman’s piece relies. The BEA price index reflects the costs of both materials and labor used in constructing highways. We can be confident it reflects both types of costs because it is an explicit composite of two other indices: the Producer Price Index (PPI) for Highways & Streets—which like the NHCCI measures prices for road construction materials, but, unlike the NHCCI, from the seller’s, not the buyer’s, perspective—and wage costs from the Employment Cost Index (ECI) for Construction worker compensation (both the PPI and ECI series come from the Bureau of Labor Statistics). In other words, the BEA approach guarantees that the index will always incorporate materials and labor costs together.
Finally, the Bureau of Reclamation (USBR) produces a construction cost trends index that combines PPI data on various materials as well as other public and private data on materials, lands, and labor, weighted to different types of Bureau of Reclamation projects. In other words, the USBR approach is similar to BEA’s with some overlapping and some distinct data. We include their “Primary Road” subindex below.
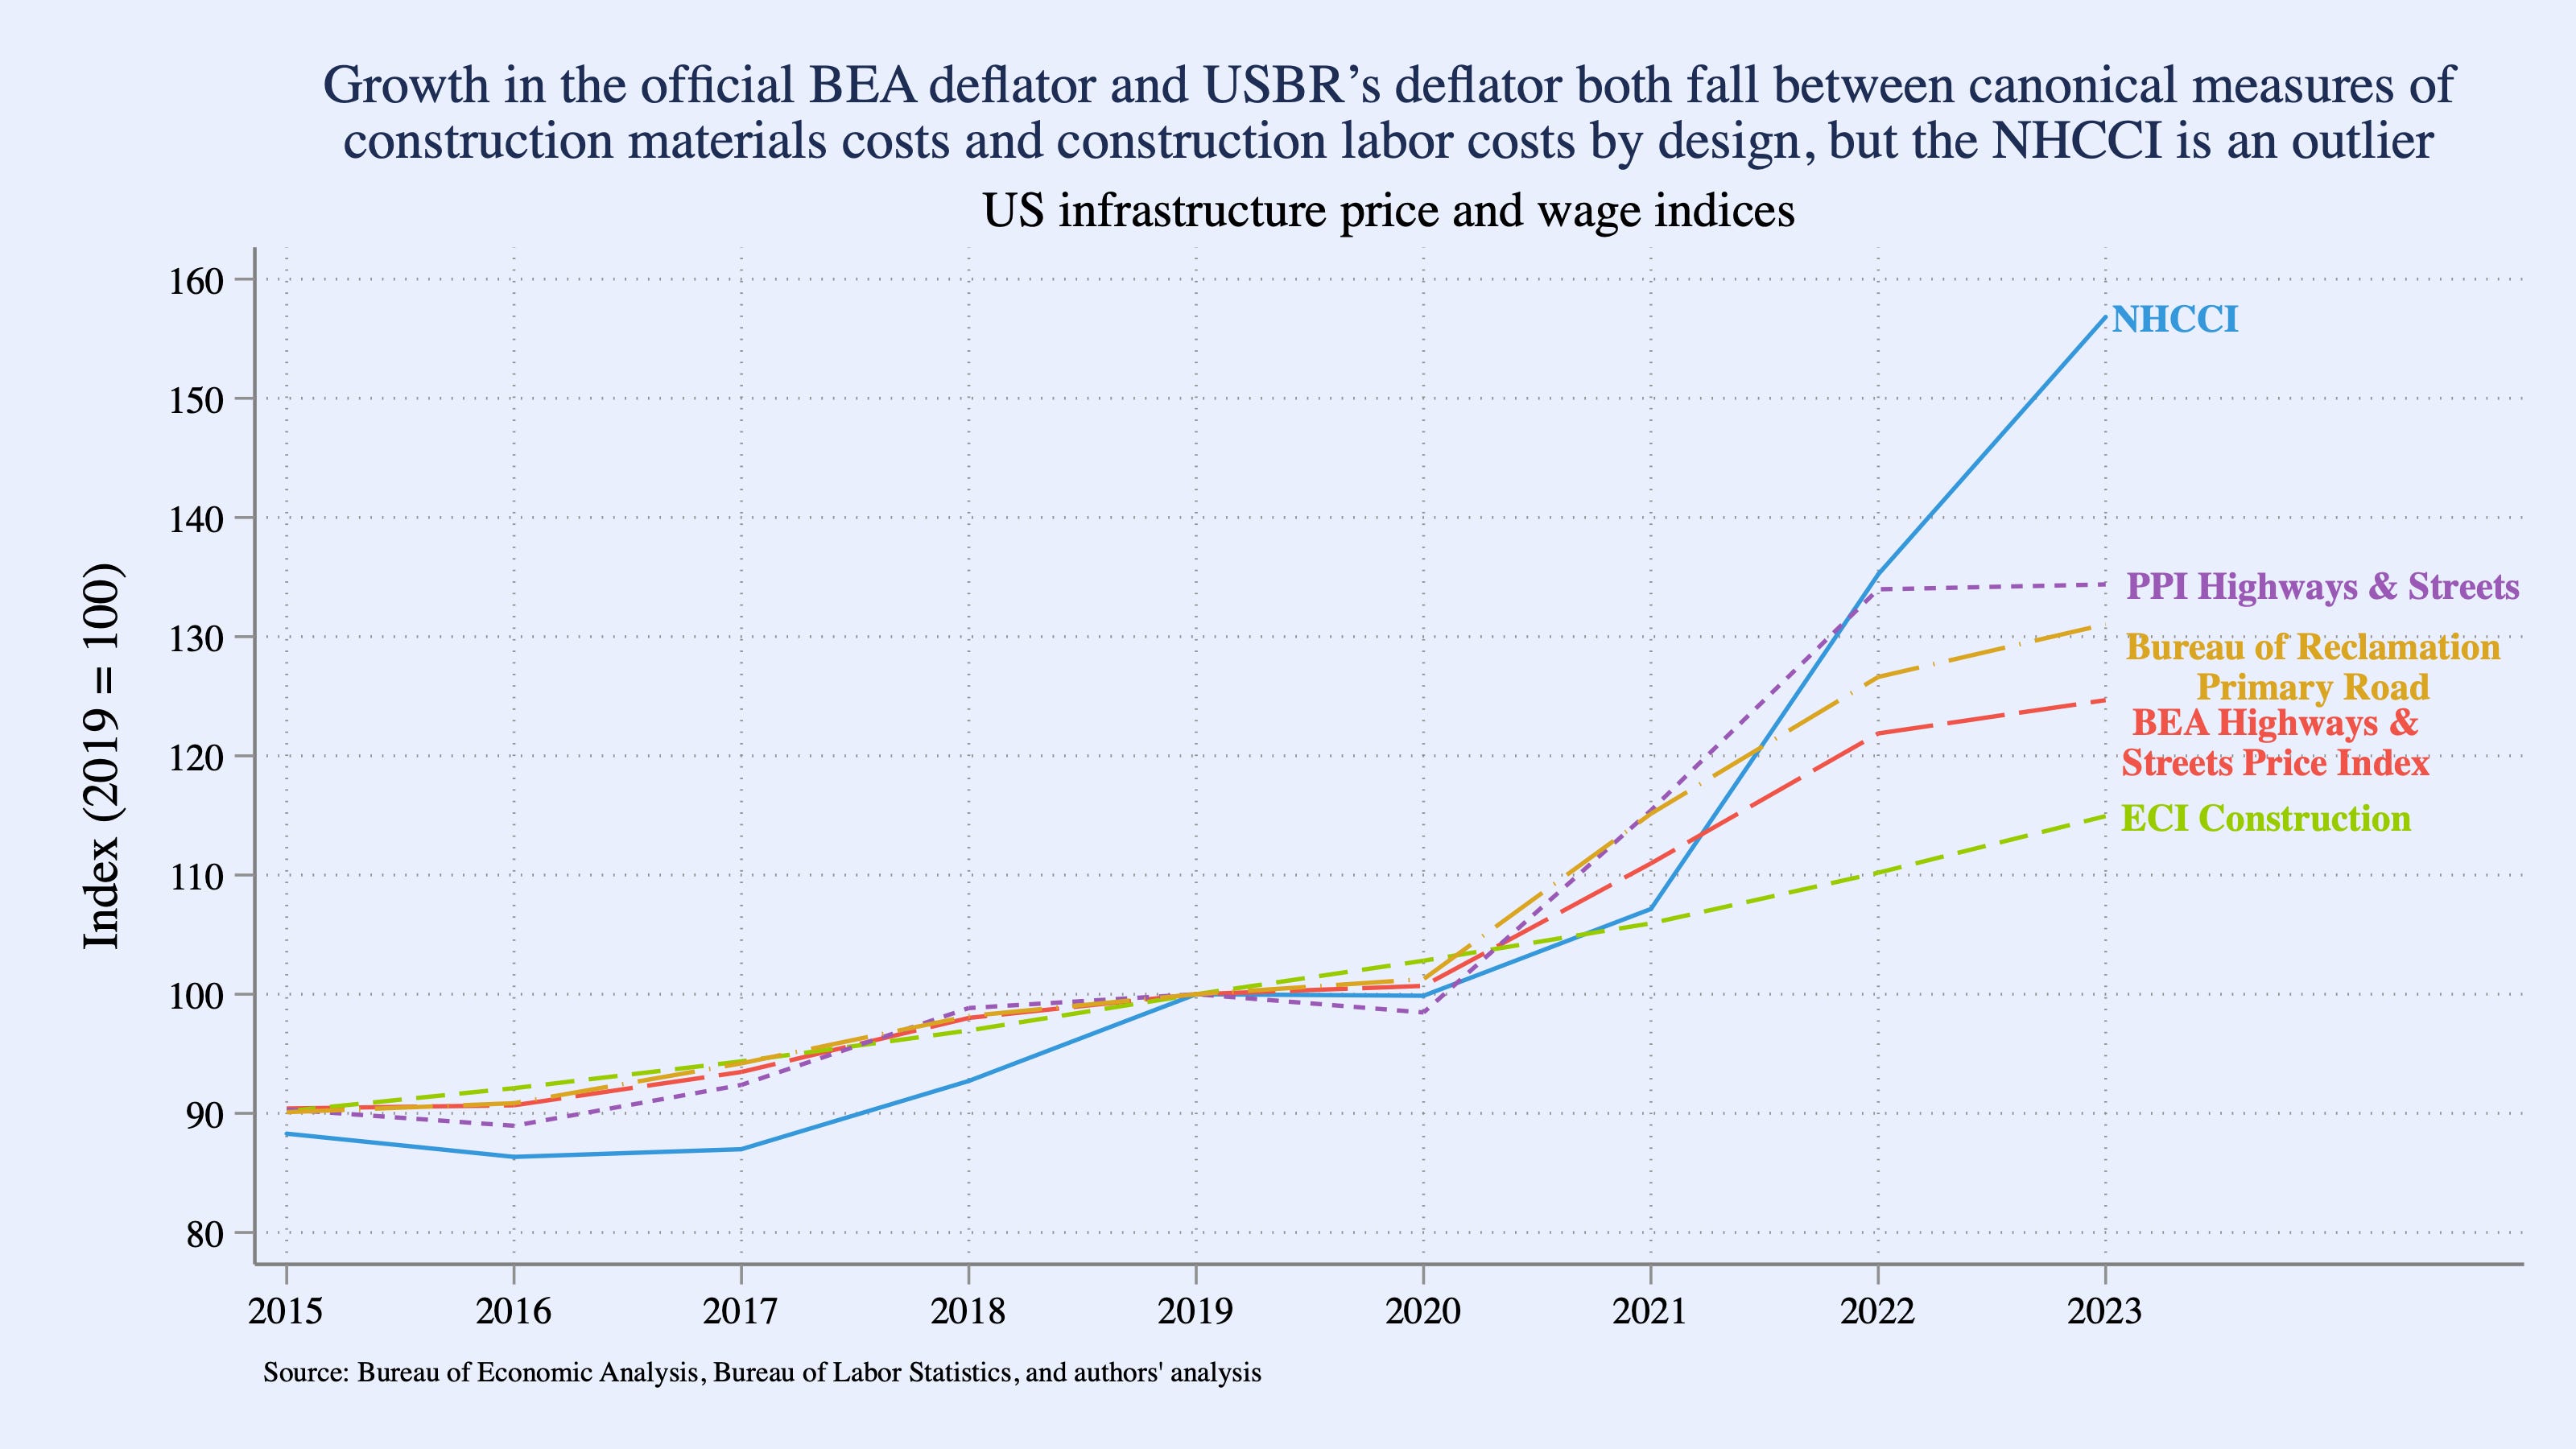
The chart below compares each of these series and indexes them to a common 2019 base for comparison. The key takeaway is that the NHCCI is a major outlier among these cost indices. It grew significantly faster than the other measures, especially in 2023. Deflating by the NHCCI rather than by BEA’s official measure or USBR’s will therefore by definition show lower real highway spending than using any other deflator on the table.
The drivers of the deviation between NHCCI and the BEA and USBR measures are not entirely clear, since in theory all three should account for materials and labor costs. One hypothesis is that the NHCCI in practice underweights labor costs, since it is estimated from winning bids at the time of award; this approach could understate the true labor cost share of final costs if a project runs long, utilizes more overtime than anticipated, or if contractors intentionally underbid labor costs due to cost-plus or other provisions. As the chart shows, underweighting labor costs would compositionally raise a composite index, since construction compensation grew more slowly than materials costs measured either by NHCCI or PPI. The fact that NHCCI and PPI, which by design excludes labor costs entirely, rose in tandem through 2022 supports this hypothesis. That approach may be appropriate for some purposes. But for the goal of deflating nominal dollars spent on construction labor and construction costs, a method reflecting the final balance of material and labor costs is more appropriate.
Of course, another possibility is that the NHCCI is correctly measuring the prevailing average cost of building a highway in the United States, reflecting the prevailing balance of material and labor costs, and the other two indices are not. If true, however, that raises much larger and more serious questions about price and wage measurement in official data, since both the BEA and USBR measure draw heavily on different PPI and ECI series that are supposed to be capturing the same price and wage drivers NHCCI is implicitly picking up.
In the end, the conclusion about real US highway spending over the pandemic is completely different depending on the deflator, as shown in the introductory chart. Using either the official BEA price index for highways that goes into GDP, or the USBR construction cost trends index for primary roads, real public highway and street construction fell in 2021 but then grew in 2022 and then shot up in 2023 to levels unseen since 2006. Deflated by NHCCI, real highway spending ended 2023 at its second lowest point in the past two decades.
Broader measures of real infrastructure have boomed
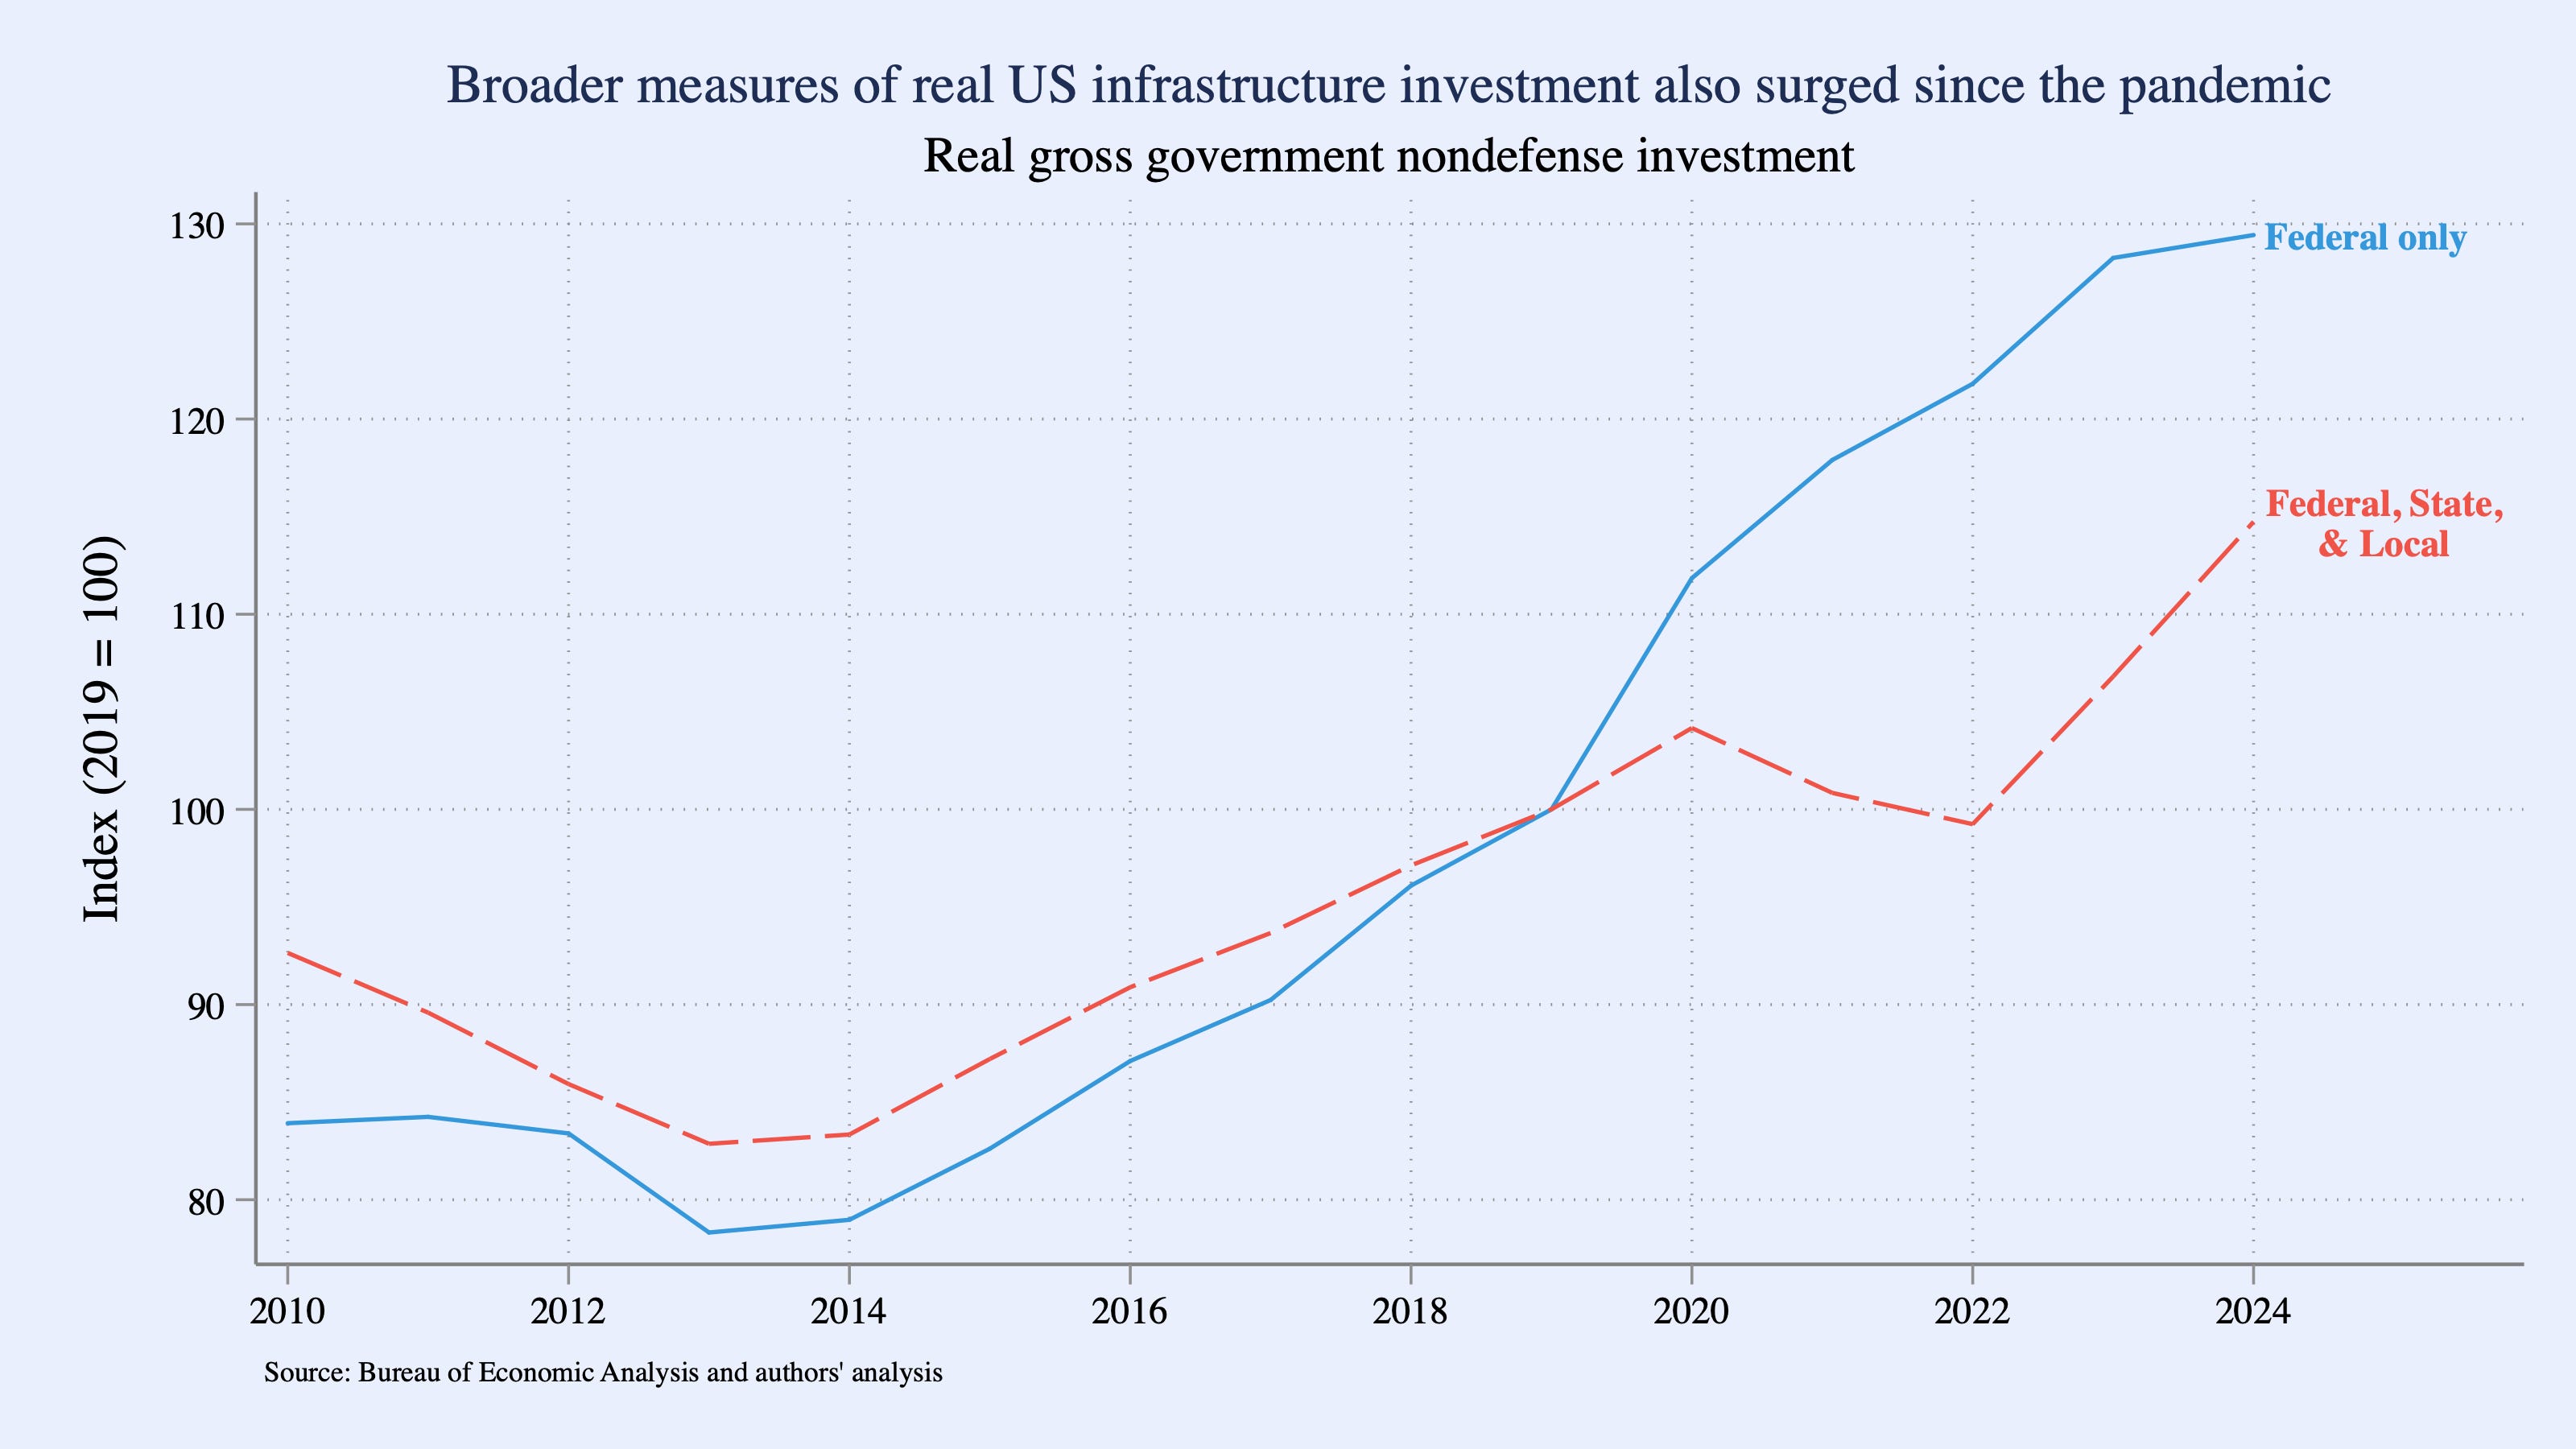
Broader measures of real infrastructure investment beyond highway construction also show a significant increase since the pandemic. There are many ways to define and measure infrastructure investment; the highway spending data that Professor Furman and we have focused on thus far are indeed an important specific element. The chart below takes a broader view, showing all gross public investment outside the defense sector—including highways and streets, but also other transportation, power, and public building construction. This measure may be somewhat overinclusive for your chosen definition of infrastructure, including things like software and investment in conservation. The BEA publishes this real data directly, using official deflators produced just for these time series. At both the Federal level and across all levels of government, real public nondefense investment has risen significantly since the pandemic—consistent with the narrower view of highway spending (using all deflators except the NHCCI).
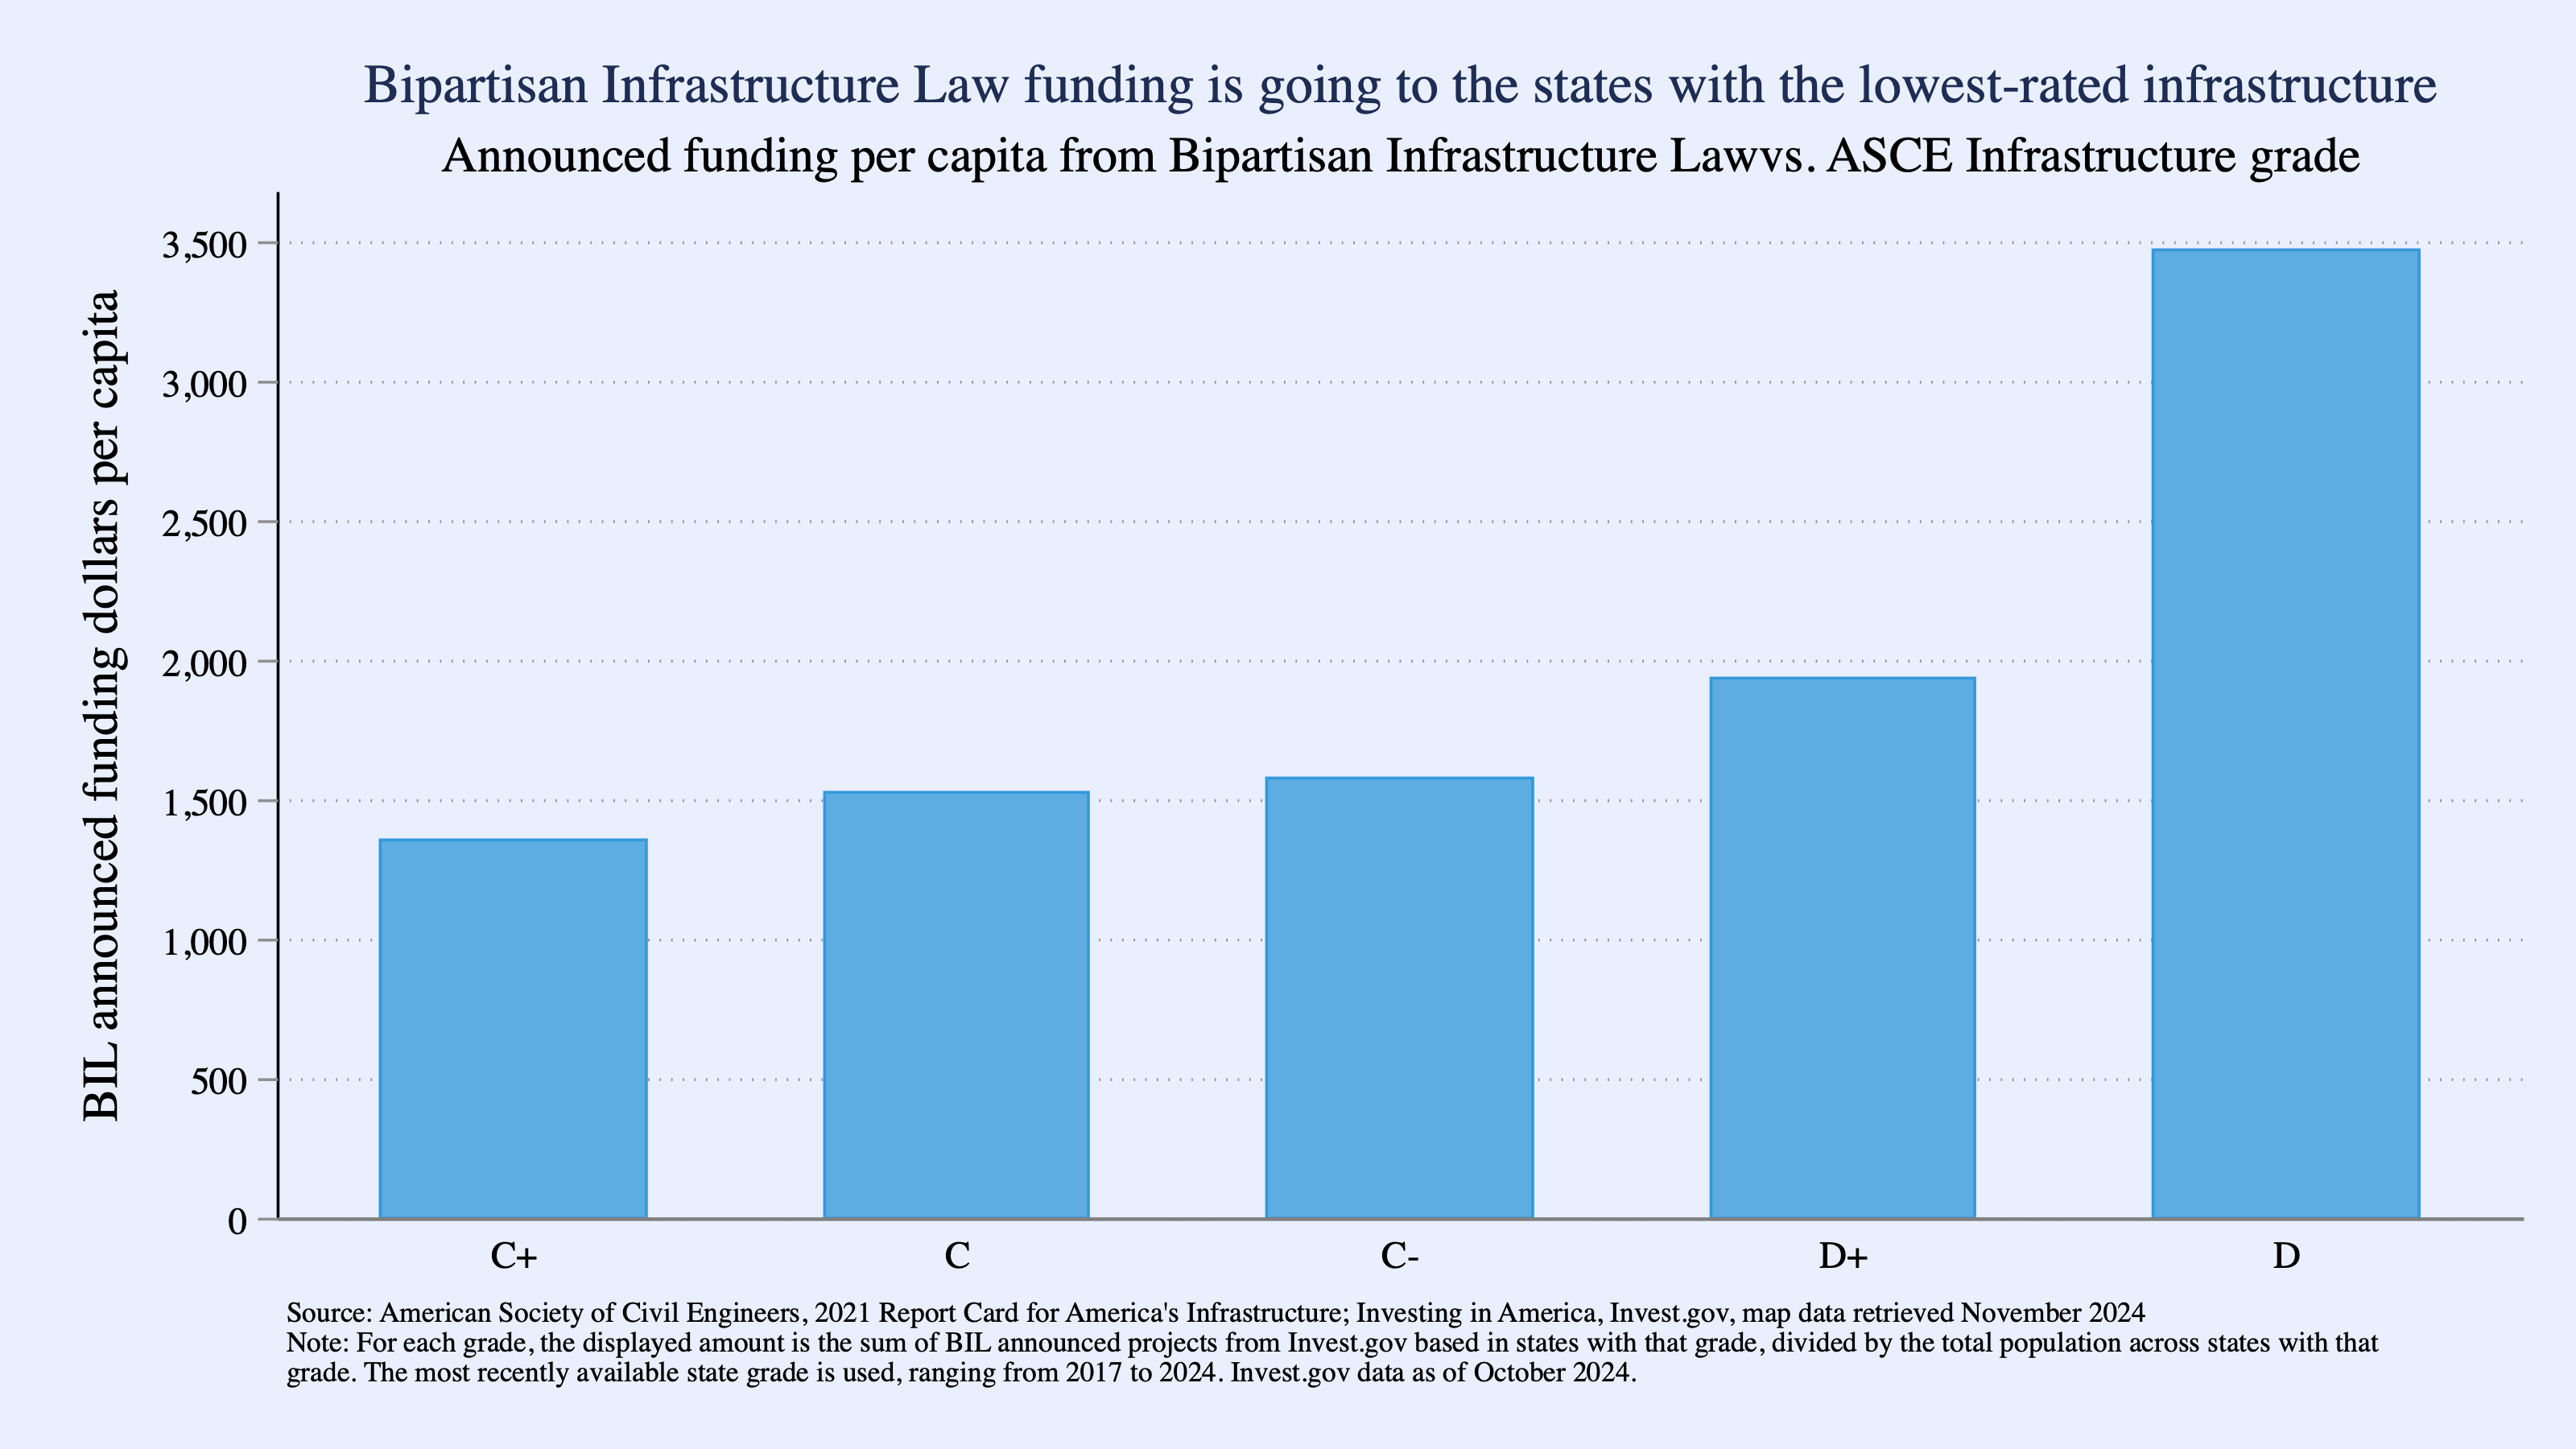
Beyond the macroeconomic data, one may wonder whether the new public investment is being dispersed efficiently. Importantly, the post-pandemic infrastructure spending appears to be landing in the places that need it most. The American Society of Civil Engineers (ASCE) grades U.S. states on the quality of their infrastructure across several dimensions, including roads, bridges, water, and public transit. The chart below tallies infrastructure projects announced with funding from the Bipartisan Infrastructure Law (BIL) since its passage in 2021. It shows the per-capita BIL funding going to states with various ASCE grades. The states most in need of infrastructure improvements are disproportionately attracting funding. This suggests that the BIL was targeted thoughtfully and, in turn, was more likely to be effective in real terms.
Directly measuring highway length shows a surge in infrastructure growth
So far, the answer about real highway spending during the pandemic depends on the deflator used. Is there any validation of real infrastructure investment during the pandemic without relying on nominal spending data and adjusting it for inflation?
Recall that the goal of a real series is to estimate the quantity of investment. There are a few ways we can proxy for the quantity of investment without deflating spending data.
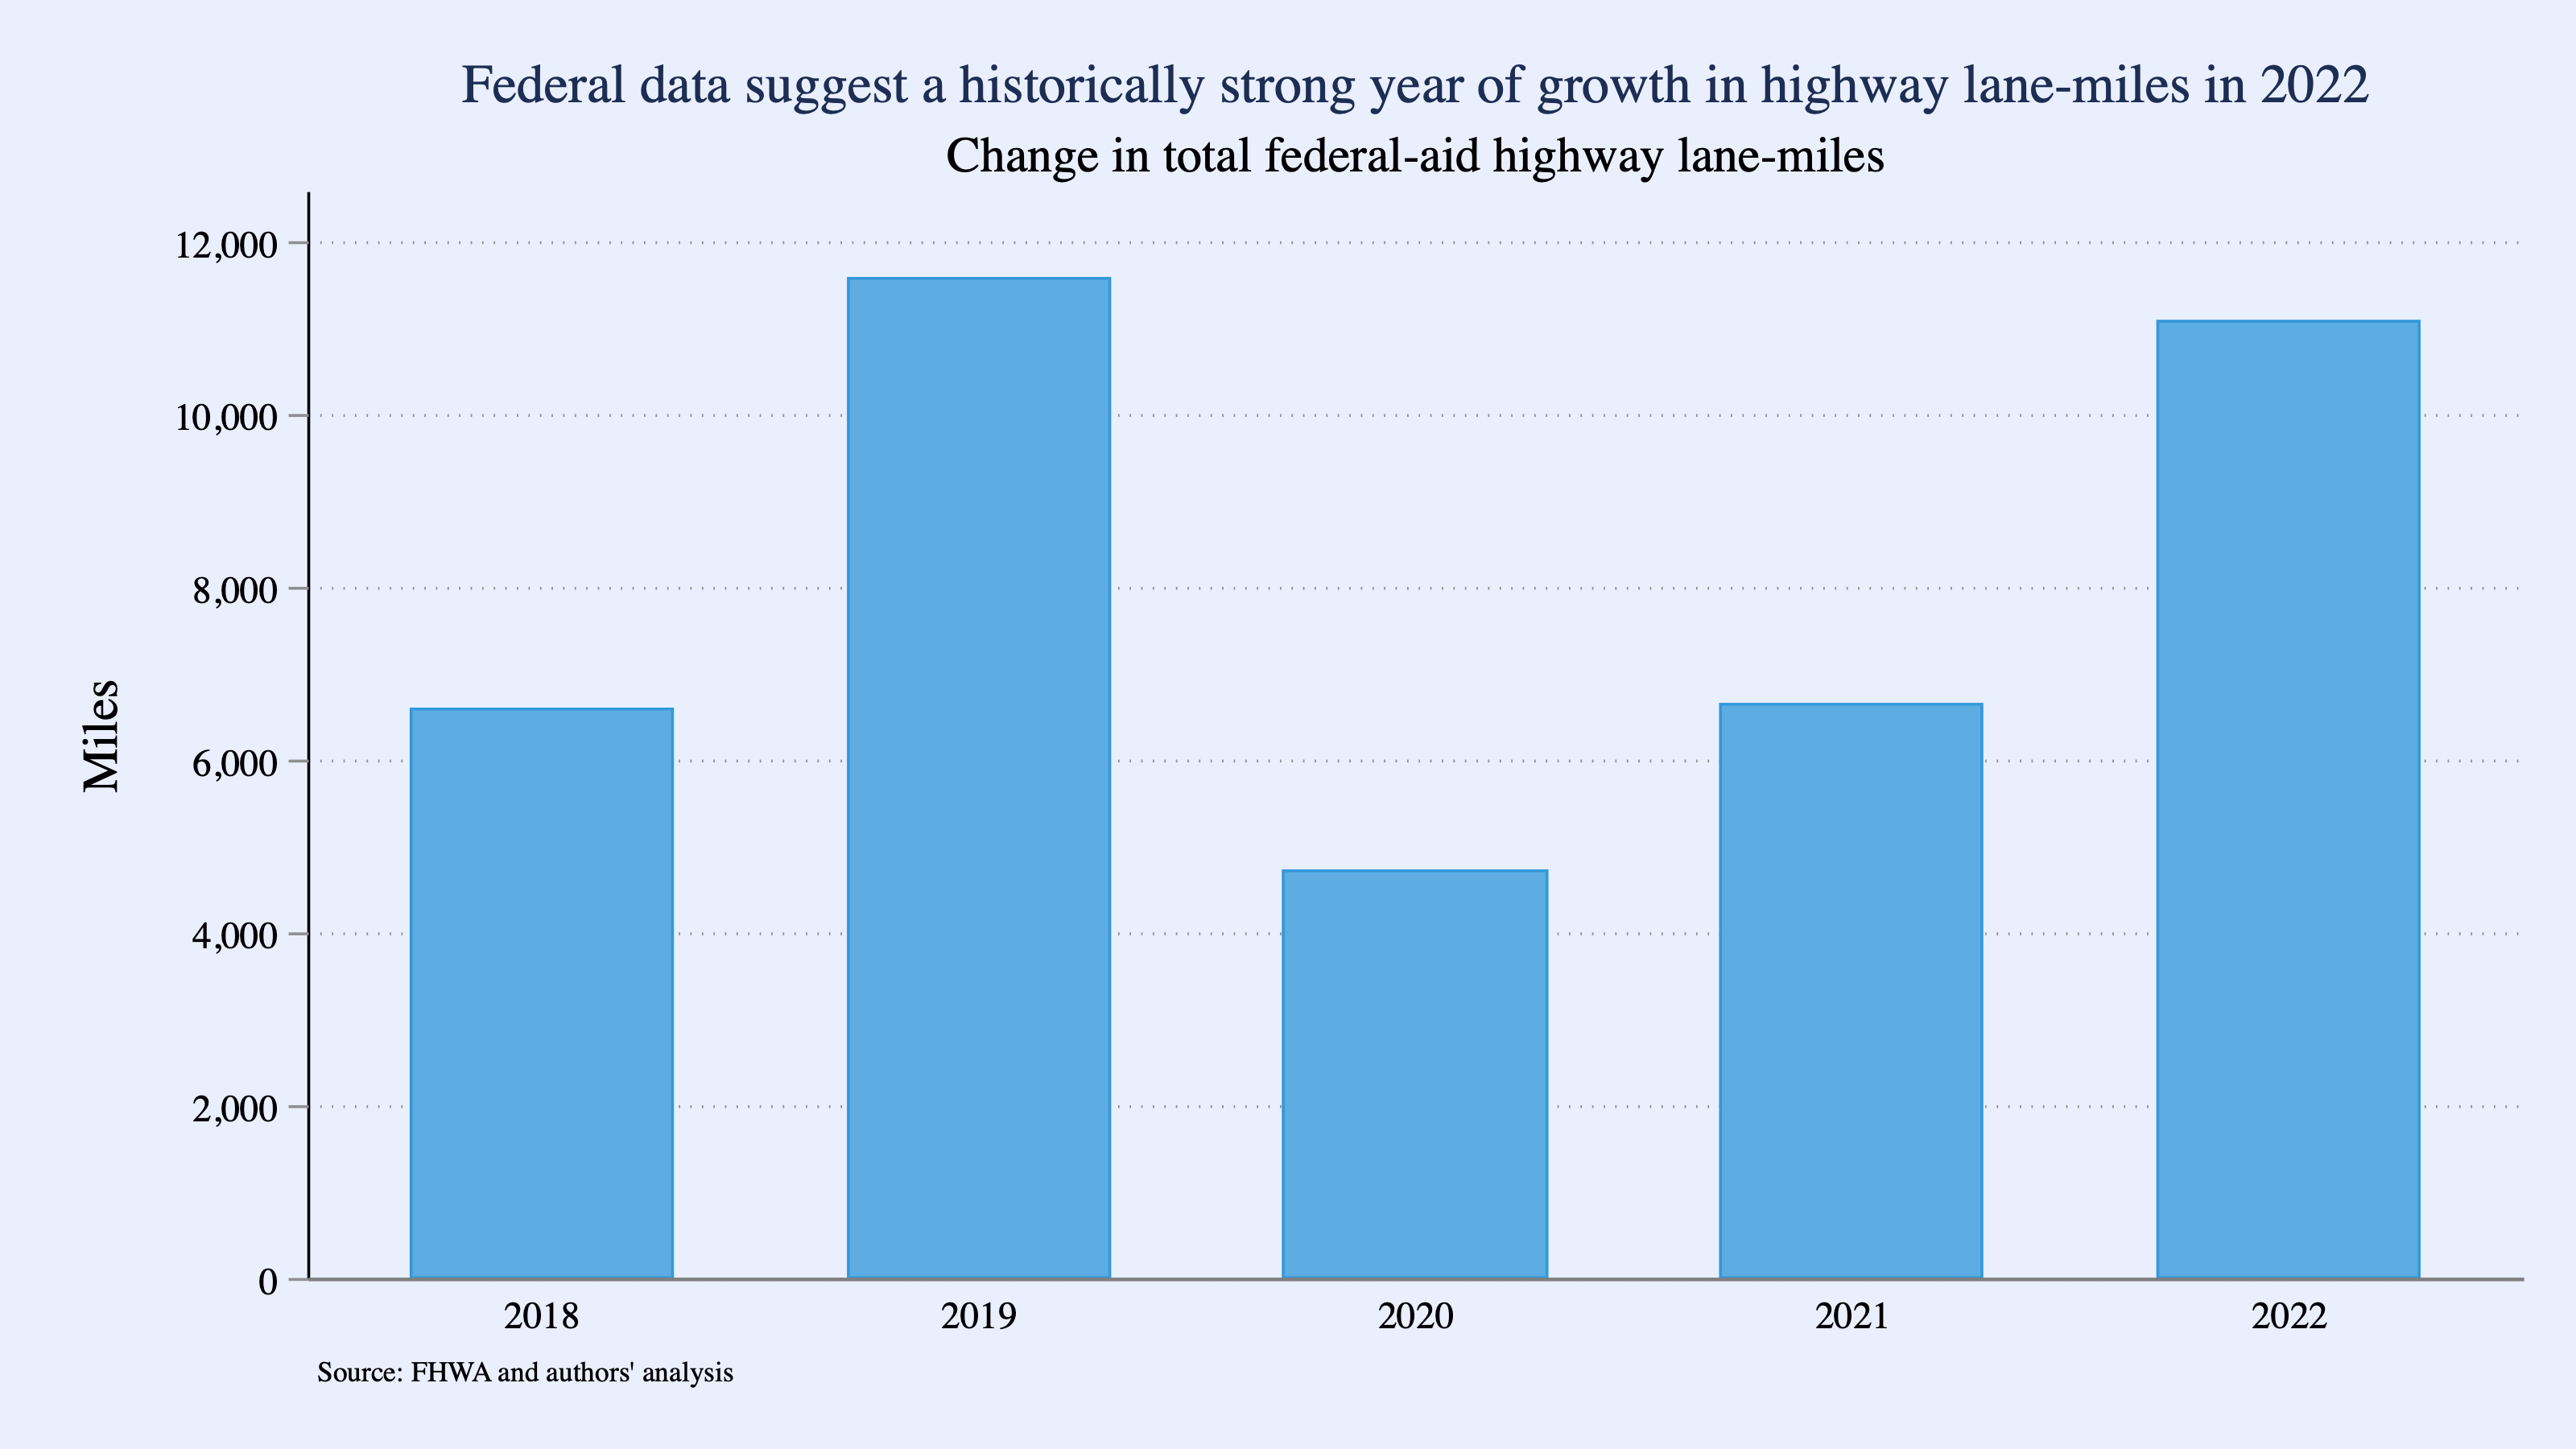
One is to ask, “How much highway was built during the pandemic?” To estimate this, we look at the annual change in the number of lane-miles of federal-aid highways in the US as reported by FHWA. Granted, this is not a perfect parallel to the highway construction figures used earlier. First, construction spending is recorded at the time a highway project is started, whereas lane-miles only increase once a project is completed, so there is a timing difference. Second, construction spending is a gross investment concept, without adjustments for depreciation, whereas change in lane-miles is a net concept, since it will reflect both new highways coming online but also highways that close due to deterioration, disaster, or other depreciation.
With those asterisks in mind, what we see is that the quantity of federal-aid highways grew consistently throughout the pandemic (2023 data have not yet been released by FHWA), and in fact 2022 saw the largest expansion in the length of federal-aid highways, as measured by lane-miles, since pre-pandemic. While 2022’s net new lane-miles do not exceed 2019’s in these data, they are well above 2018’s, 2020’s, and 2021’s. In contrast, the NHCCI-deflated highway spending suggests 2022 should have been the smallest year in decades. The pattern of the FWHA data is thus closer to the BEA- or USBR-deflated spending data than the NHCCI-deflated data.
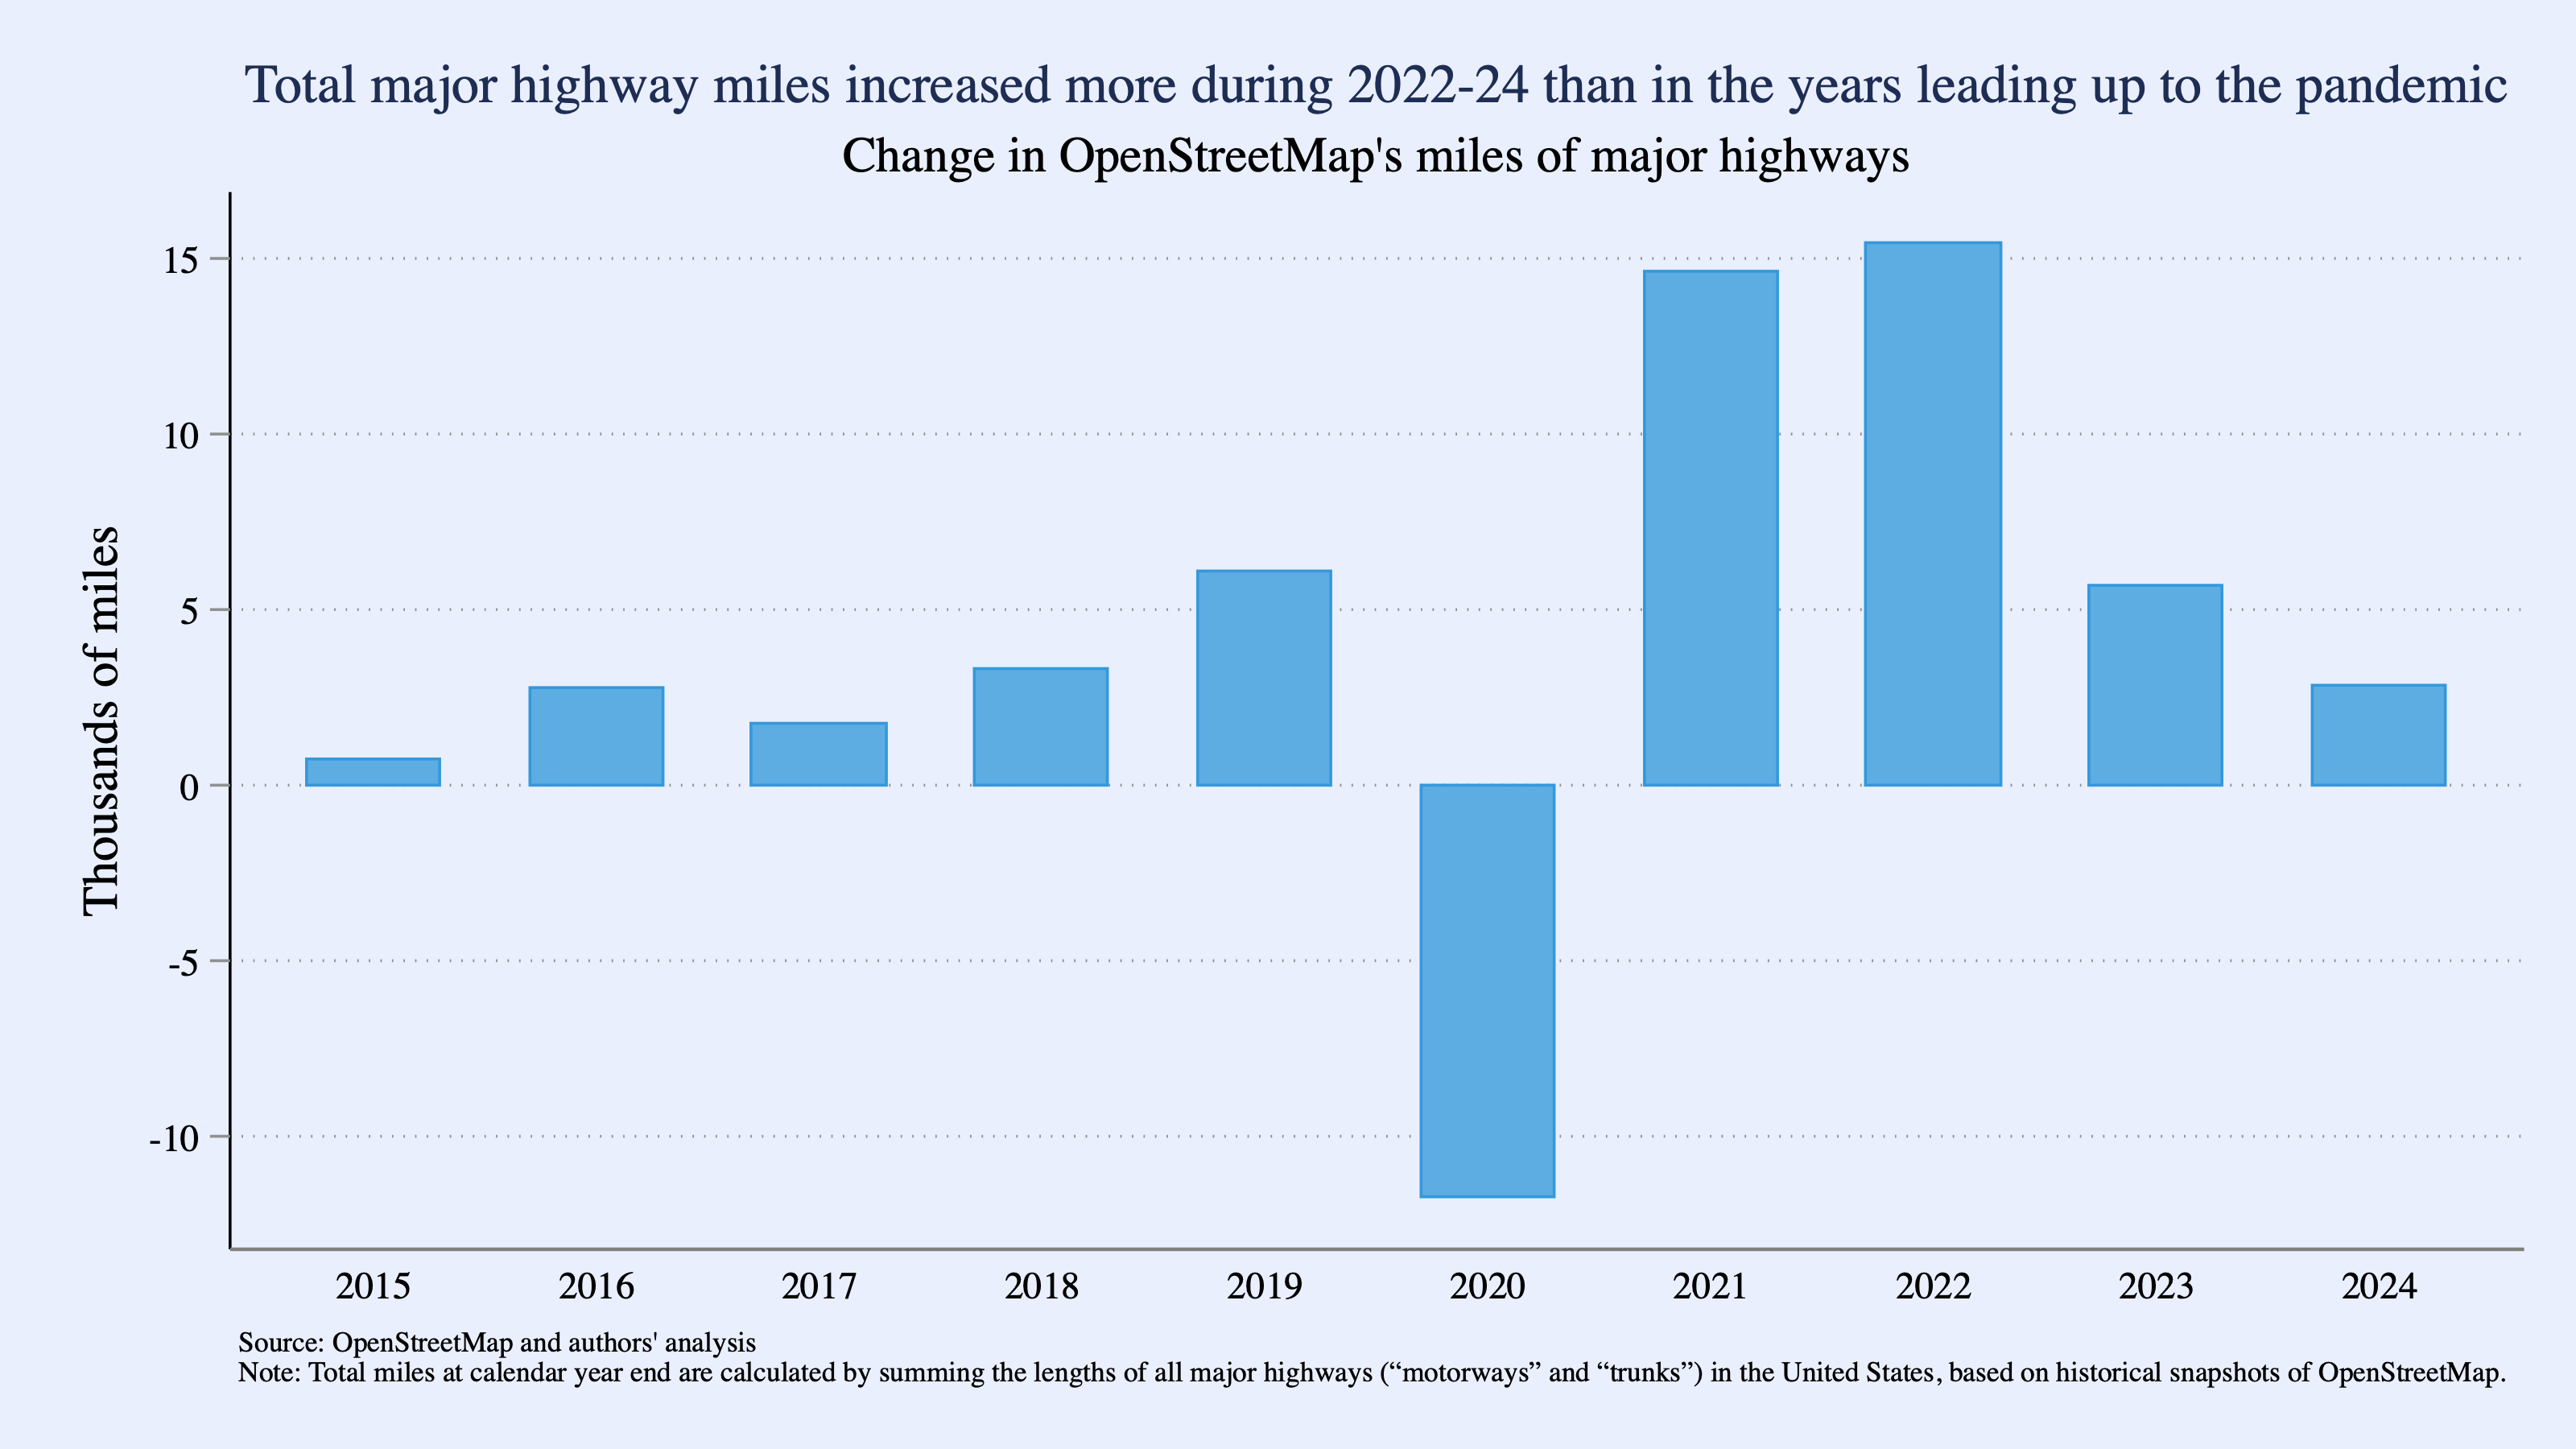
Another non-spending measure of highway construction can be inferred from OpenStreetMap, a freely available database tracking global geographical information including roadways. We took historical snapshots of OpenStreetMap’s freely available data listing the locations and lengths of all roadways in the United States, and measured the total miles of highway in the United States at the end of each of the past few calendar years. Again, this is a slightly different concept: our sample does not reflect federal-aid highways specifically, but rather all major public roadways in the United States. (Specifically, we count those roads classified in OpenStreetMap as “motorways” or “trunks,” corresponding to major highways; this excludes smaller highways, residential streets, and service roads.2) But importantly, OpenStreetMap is updated nearly in real-time, so we can extend our analysis through 2024. This measure saw a dip in 2020, likely as typical road closures were not offset with new construction during the pandemic. But after a rebound in 2021, the following three years were stronger than any period prior to the pandemic (with data back to 2014).
Conclusion
Measuring real infrastructure investment is a complicated business, and we do not suggest that there is one unimpeachable method to do so. But most reasonable approaches point to a significant increase in real investment following the BIL’s passage in 2021. Official deflators that explicitly incorporate both material and labor costs show significant increases in real highway spending in the wake of the BIL; broader measures of real infrastructure saw robust gains as well in the official data. And while outside validation of real spending data is difficult, what we do have is consistent with the conclusion that the quantity of infrastructure rose following BIL. To support the claim that real infrastructure investment has been the weakest in decades, one must use an outlier deflator that shows considerably higher prices than comparable measures.
The trade-off between choice of base year and adding/subtracting real components gets much more complicated when using chain-weighted/Fisher price indices like the NHCCI or BEA’s indices. We save that topic for another discussion.
Road definitions from OpenStreetMap wiki, https://wiki.openstreetmap.org/wiki/Key:highway
 | A guest post by
|
 | A guest post by
|
excellent piece! ALWAYS appreciate careful analyses by folks who actually understand the data.