Digesting inflation
The impact of inflation on consumer sentiment decays at a rate of about 50 percent per year
One commonly proposed explanation for weak consumer sentiment despite easing annual inflation is that consumers are still digesting the impact of prior years’ price increases. While prices rose only 3.2 percent this year, they increased by a cumulative 18.6 percent over the last 3 years, and these prior price increases may still be weighing negatively on consumer sentiment.
We estimate the impact of current and prior years’ inflation on consumer sentiment and find that the impact decays at a rate of about 50 percent per year. Despite much lower annual inflation, the cumulative negative effect of recent inflation on sentiment declined only 40 percent between June 2022 and today. If we experience 2.5 percent inflation over the next 12 months, we estimate the cumulative downward drag will drop by another 50 percent.
Consumer sentiment has failed to recover
The University of Michigan Survey of Consumers has been tracking consumer sentiment since 1978. Each month, surveyors ask a nationally representative sample of Americans their view on current and expected economic conditions, which they aggregate into a Consumer Sentiment Index. The index measures net favorability, with a value of 100 indicating an even split between positive and negative responses, and lower values indicating more negative than positive views.
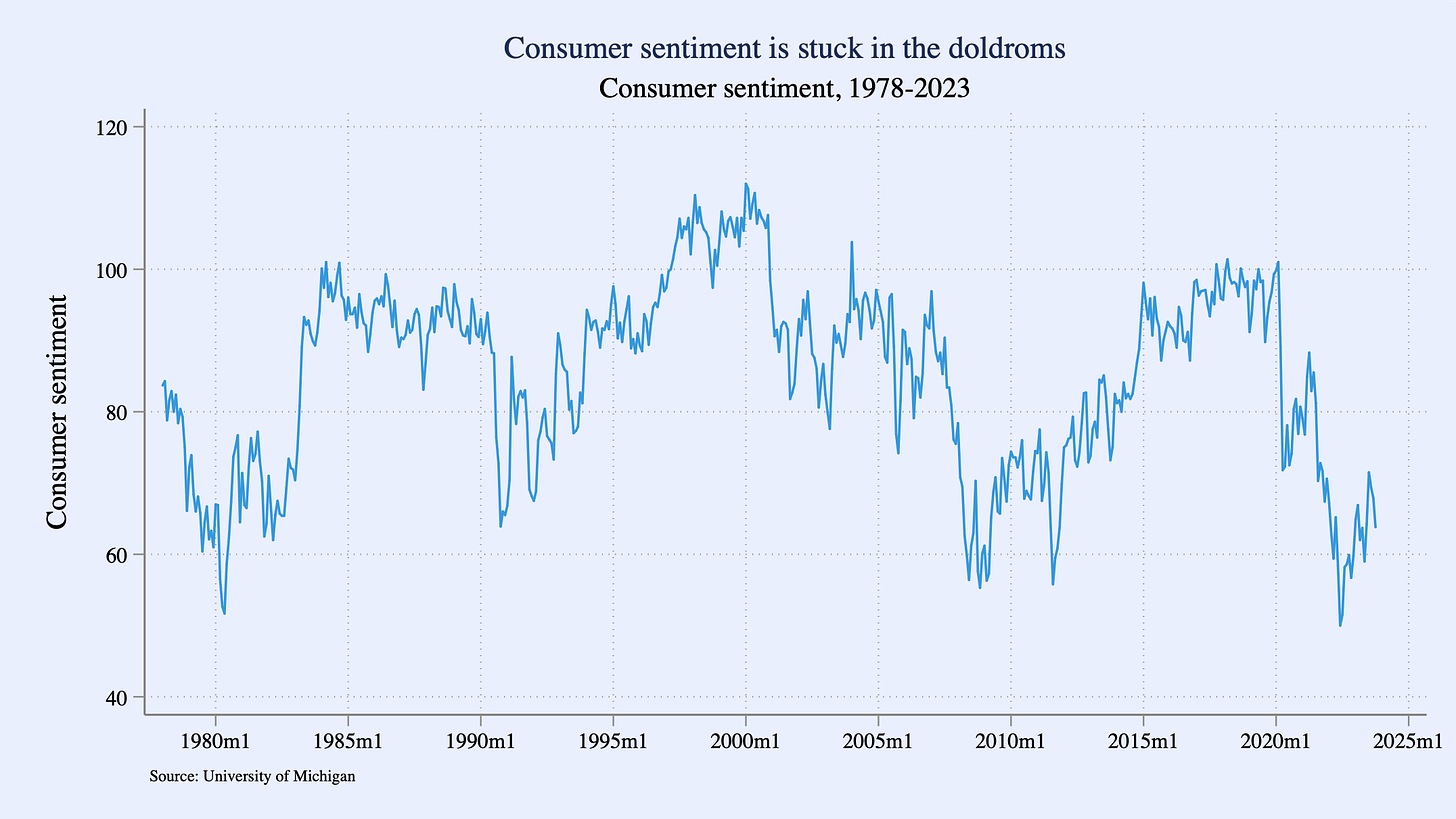
The index hit an all-time low of 50.0 in June 2022 and remained in the 50s through the rest of last year (see figure). The initial drop in sentiment was expected given the high annual inflation rate and darkening economic prospects. In June 2022, annual inflation peaked at 8.9 percent and gas prices topped out at $5.01 per gallon. In the following months, forecasters downgraded their economic outlooks, with a majority predicting a recession in the coming year.
Since then, however, annual inflation has eased to 3.2 percent, gas prices have fallen to $3.31 per gallon, and Goldman Sachs recently concluded that recession risk is no longer elevated. Yet consumer sentiment has remained stuck in the 60s, a range it last consistently occupied during the Great Recession.
The impact of inflation on consumer sentiment decays at a rate of about 50 percent per year
In a previous post, we argued that 30 percent of the gap between consumer sentiment and what you would expect based on economic conditions can be explained by asymmetries in partisan bias. Republicans cheer louder and boo harder in their survey responses than Democrats, dragging down sentiment when a Democrat is in the White House (and vice versa when a Republican controls the executive branch).
In this post, we examine another commonly proposed explanation for the mismatch between consumer sentiment and economic fundamentals: gradual adjustment by consumers to higher prices. While prices increased only 3.2 percent this year, they increased 7.7 percent in the prior year, and 6.2 percent in the year before, for a cumulative increase of 18.6 percent over the last three years.1 If it takes time for consumers to acclimate to the new price level, current sentiment may reflect the fact that past price increases are still dragging down consumers’ perceptions of the economy.
We assess this explanation with simple regression models that relate consumer sentiment to inflation contemporaneously and in prior years (economists call prior inflation “lags”). Intuitively, this approach takes historical inflation episodes and examines how their impact on consumer sentiment phases out over time. We estimate these models using data from 1978-2023 (the entire range with consumer sentiment data), adjusting for other economic factors.
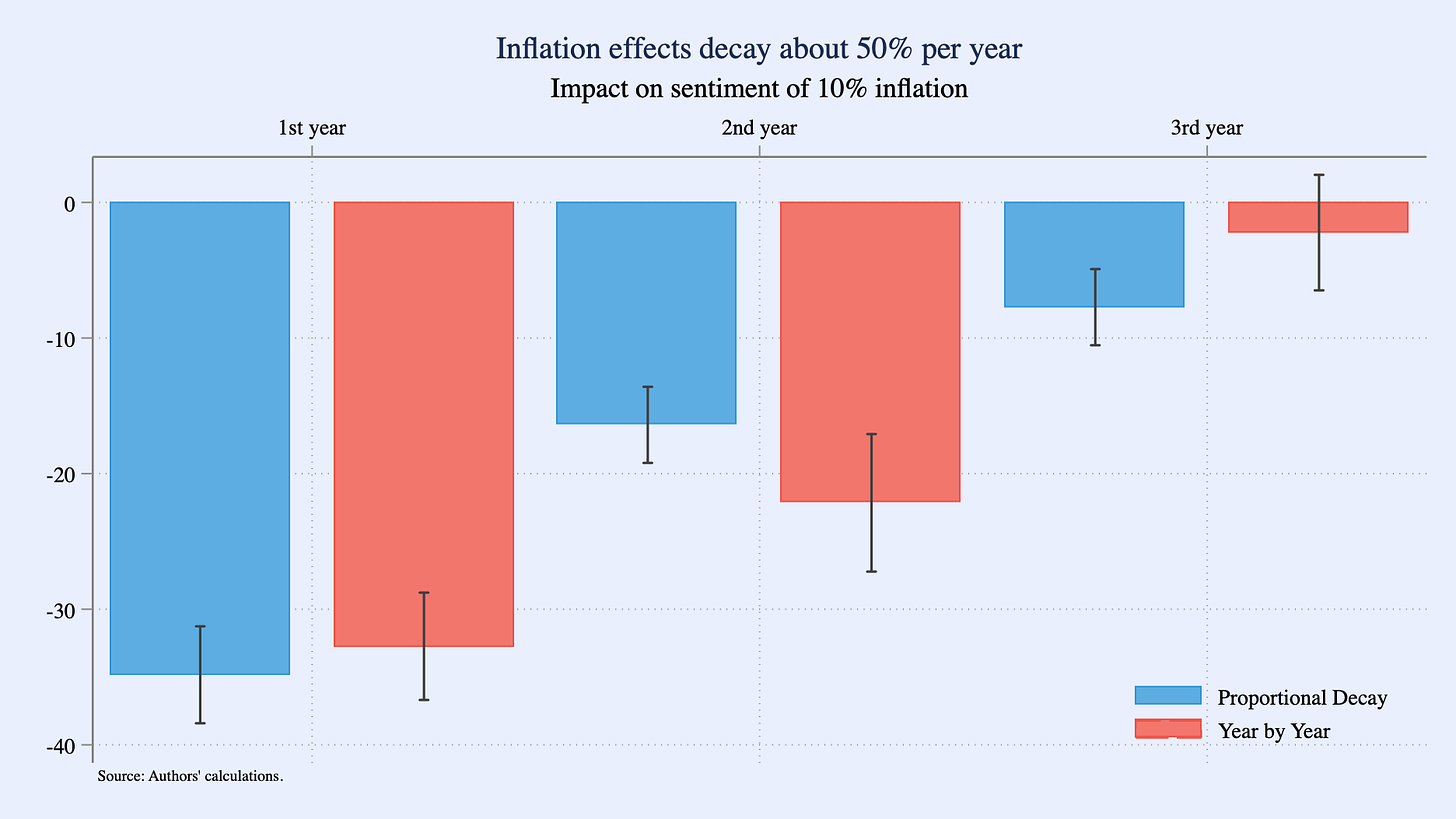
The figure shows the phase-out of a 10 percent inflation shock (above the target inflation rate of 2 percent) for two versions of our preferred model (model 4 below): a model where we impose a constant proportional decay rate and a more flexible model where we allow the decay rate to vary on a year-by-year basis.2 In the proportional decay model, a 10 percent inflation shock reduces consumer sentiment by 34.8 index points in the first year and then decays by 53 percent in each of the following years.3 In the flexible model, we estimate an effect of -32.7 index points in the current year, -22.2 index points in the second year, and -2.2 index points in the third year.
The table below shows estimates from our preferred model and alternative specifications that control for different economic factors. While the magnitude of the effects shows some variability, the qualitative patterns are similar. The decay rates range from 50 to 76 percent across the proportional decay models, and the phase-out patterns are qualitatively similar across the more flexible specifications.
The majority of the post-pandemic inflation shock will have faded away by next year
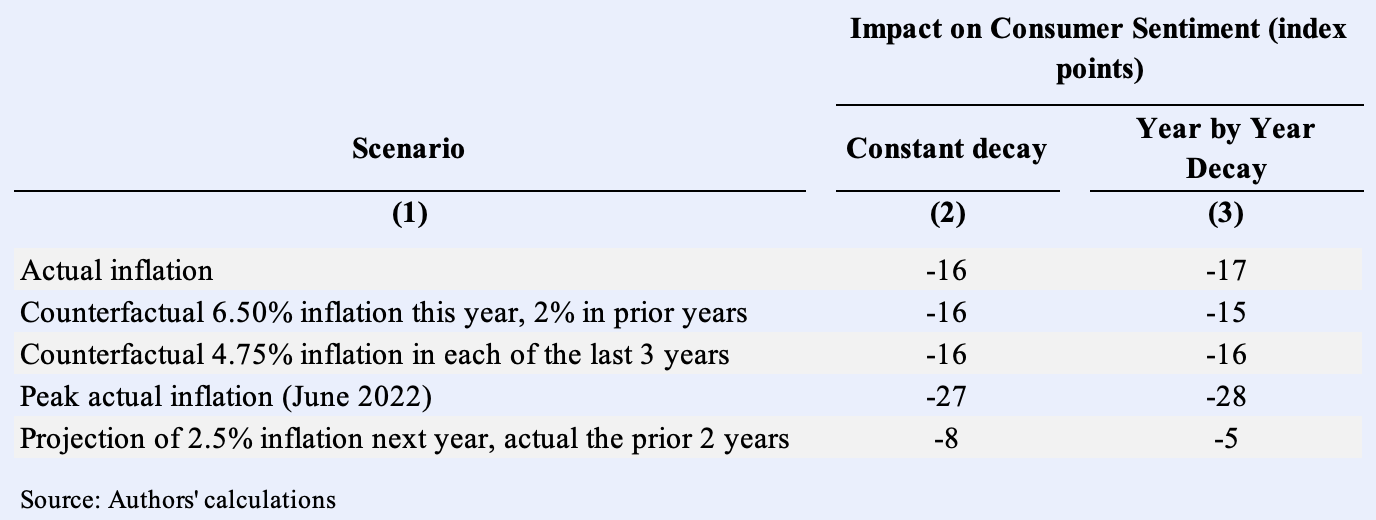
Consumers are currently digesting 3.2 percent current inflation, 7.8 percent inflation from last year, and 6.2 percent inflation from the year before. If we scale these numbers by the estimated impacts from our preferred proportional model and add them up, we get a cumulative downward drag of -16 index points relative to a baseline with target 2 percent inflation (see table). This is down only 40 percent from the -27 index point cumulative effect in June 2022, which was the month with peak annual inflation and the largest cumulative downward drag on sentiment.
The table below shows the results of a few exercises that put the current -16 point impact in context. This cumulative impact is approximately equivalent to what you would get from 6.50 percent inflation this year and target inflation of 2 percent in prior years. It is also what you could get if inflation had been 4.75 percent for each of the last three years.
We can also use our model to project forward how the cumulative impact would change over the next year for a given projected inflation rate. Most forecasts put inflation over the next year at close to 2.5%.4 If we plug in this forecast, we calculate that the cumulative impact of inflation on consumer sentiment will be -8 index points a year from now, a 50 percent reduction relative to the current impact of -16 index points and a 70 percent reduction from the peak impact of -27 index points that occurred in June 2022. The figure shows the month-by-month projection, assuming that inflation declines linearly from 3.2 percent to 2.5 percent over the next 12 months. Holding all else equal, this would raise overall sentiment from 64 to 72 index points.
Inflation is one of many drivers of low consumer sentiment
We find that the impact of inflation on consumer sentiment fades out with a decay rate of about 50 percent per year, with a 10 percent inflation shock reducing sentiment by 35 index points in the current year, 16 index points the following year, and 8 index points the year after. The estimates imply that current sentiment is being dragged down by 16 index points by the inflation we have experienced over the last 3 years, down 40 percent from the peak negative impact of 27 index points in June 2022. If inflation next year slows to 2.5 percent, the negative impact on consumer sentiment from inflation would decline by another 50 percent relative to the current value.
The 1978-2023 data period is characterized by two major bouts of inflation (the inflation of the early 1980s and the post-pandemic episode) and our results are largely determined by the phased response of consumer sentiment to these episodes. While we estimated qualitatively similar phase-out with the alternative models we tried, there are likely control variables that would produce different estimates.
We recognize that the historical relationship we identify provides an imperfect guide to the future path of economic sentiment. As many have noted, the rise of social media as a prominent information source – with misleading viral posts on high prices – may have scrambled the link between economic fundamentals and consumer sentiment to some extent. While outside the scope of this note, we eagerly await more sophisticated research on this topic.
This year’s inflation is based on the change between October 2023 and October 2022 (the most recent full year available). The prior years are based on October-to-October changes for the corresponding periods.
The constant proportional decay specification, which fixes the decline to be the same proportionally between years 1 and 2, and between years 2 and 3, is a natural way to model phase-out and is not statistically distinguishable from the more flexible year-by-year specification. Because the proportional decay specification is based on 2 parameters, rather than the 3 parameter year-by-year model, it is somewhat more robust to alternative sets of controls.
Per the properties of geometric series, with a 50% decay rate, the cumulative impact of an inflation shock is twice the first-year effect, with 75% of the cumulative effect occurring in the first two years.
Federal Reserve Board Governors had a median prediction of 2.5% for PCE inflation at the end of 2024 in their most recent Summary of Economic Projections. At the time of writing, two-year expected inflation based on the TIPS spread was 2.64%.


Hey this and the prior post are great. Thank you for running the numbers so sensibly. I pushed both of them on BlueSky, hope it helps. https://bsky.app/profile/steveroth.bsky.social/post/3kfqe7cxk2h2v
Q: If we sum partisan asymmetry effect on current econ/sentiment mismatch (30%), plus this (decaying) inflation-rate effect, what % of the mismatch is attributable to those two effects? Thanks.
Really interesting stuff. Just eyeballing things, it looks like sentiment bounced back faster after major inflation ended in the 1980s than it did in the 2020s. Does that sound right and, if so, is the difference significant? What share of the lagging sentiment you identify is driven by the 2020s rather than the 1980s inflation experiences? Are the experiences with lag in those two periods comparable?