Deliberate policy decisions have disempowered workers and increased labor market inequality
The new State of Working America Data Library shows the latest trends in productivity, wages, labor markets, unionization and CEO pay

[Editors’ note: Virtually all of the data presented in this post are accessible through the Economic Policy Institute’s new State of Working America Data Library, alongside a wide range of other indicators. Interested readers can find this new resource at data.epi.org.]
Rising inequality has been a major social and economic problem for the United States for decades. The policy agenda to stop or even reverse this inequality must start with a clear understanding of what drove it. In our view, inequality has come from the labor market, and more particularly from a range of intentional policy decisions that disempowered typical workers when they have sought wage increases from employers. In an effort to disseminate facts about labor market trends more broadly, the Economic Policy Institute has constructed the State of Working America Data Library, which allows users to easily browse and collate detailed data on wages, incomes, and employment. We hope this tool fosters a broadly shared understanding of the labor market changes we need to achieve a fairer society.
Despite recent reductions in inequality, decades of policy failures fueled public discontent and enabled billionaire public influence
In any single year since 1979 there has been a maddening gap between what the U.S. economy could be delivering for working families and what it actually delivered. The richest country in the history of the world has routinely failed to offer broad-based economic security and prosperity through a cascade of policy failures. This gap between the potential and the reality of what typical families eke out of the U.S. economy has shown up directly in skyrocketing incomes for the richest households.
There is a strong case to be made that the 2024 economy—despite just being a few years clear of two global economic catastrophes (the COVID-19 pandemic and the Russian invasion of Ukraine) —had re-attained its pre-crisis performance in record time and in a way that directed more benefits to the lowest-paid workers.
Yet the anxieties driven by the crisis, the unfamiliar burst of inflation, and a decades-long legacy of typical families rightly feeling they weren’t the main focus of policymakers made U.S. households extremely sour about the economy. A fairer distribution of economic rewards in the decades before the crises might have made the public more optimistic about the rocky economic road of 2020-2024 and less willing to take a chance on the extreme policy shift that will come as a result of their election of Donald Trump.
Further, a fairer distribution of economic rewards before the crisis would have meant far fewer billionaires able to buy their way into positions of extreme unaccountable power. Fewer billionaires would make it harder to cow politicians with threats to bring overwhelming financial force to bear in primary elections should anybody think about pushing back against this unaccountable power.
If you care how income is distributed in the United States, you need to care about the health of the labor market. The labor market is how the vast majority of typical families earn the vast majority of their income. A fairer distribution of national income will only happen if these labor markets work well for the vast majority. As a new data tool released this month by the Economic Policy Institute shows, these labor markets have not been working well. This dysfunction has been caused by intentional policy decisions and it has had profound effects on our country. In what follows we sketch out how data made available by the new State of Working America Data Library supports our arguments above, and how valuable this data could be for those looking to understand and change how our economy works or doesn’t work for the vast majority.
Economic anger in 2024 is puzzling from a short-run perspective but understandable in a broader historical context
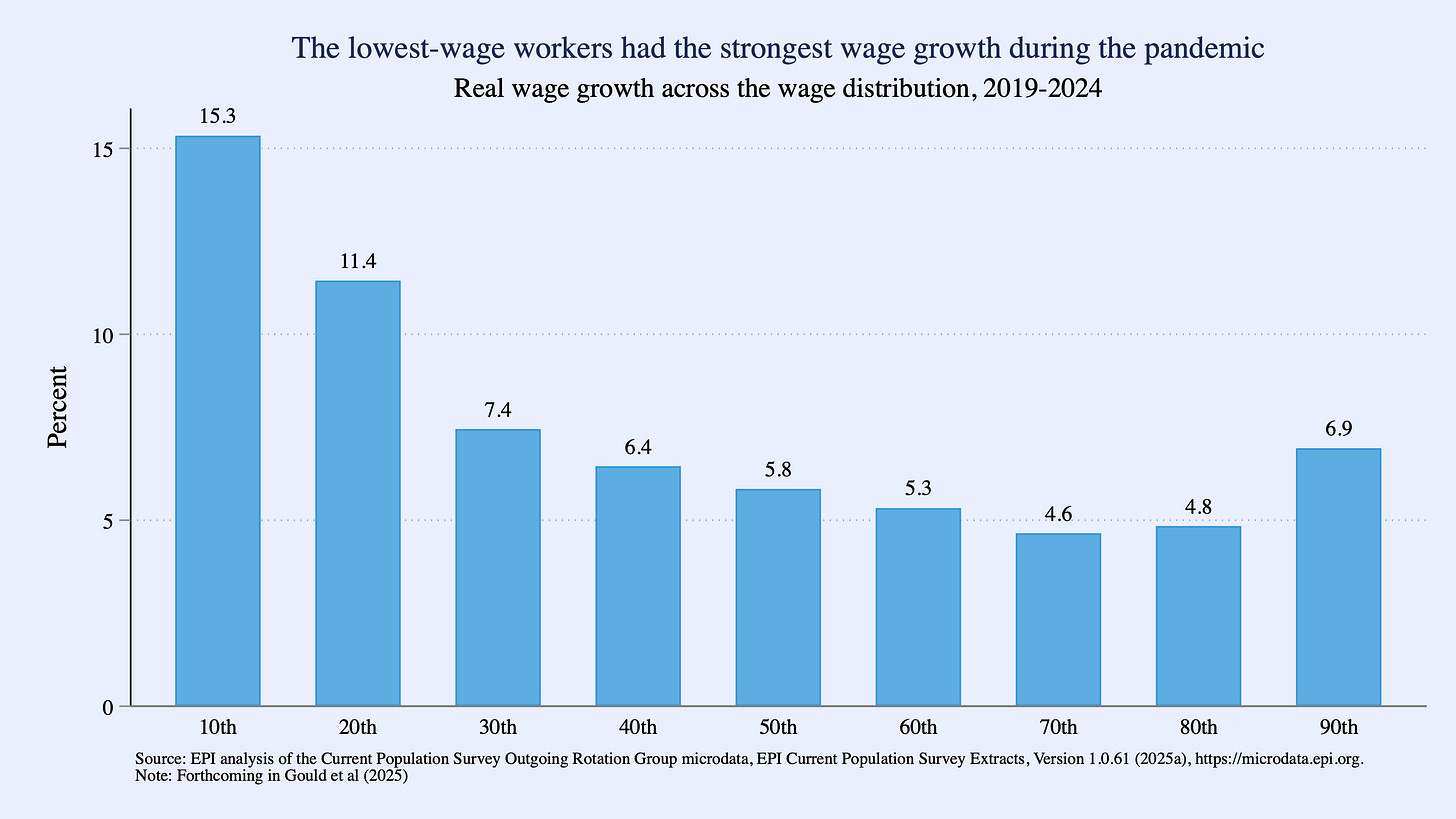
Real wage growth over the pandemic business cycle (2019-2024) was notable for how progressively it was distributed, with rates of growth becoming more rapid the further down the wage distribution one looks, as shown below in Figure A.
Figure A
However, this wage compression was highly unusual in historical context. As Gould et al (forthcoming) show, the wage compression between 2019 and 2024 was preceded by four decades of widening inequality from 1979 to 2019. Moreover, even after accounting for inflation, annual wage growth at the bottom and middle of the wage distribution was much faster in absolute terms over the last four years than it was in the preceding four decades. Annual real median wage growth in particular was twice as fast between 2019 and 2024 as it was between 1979 and 2019.
The Current Population Survey (CPS) data which lies behind Figure A—which can be accessed from 1973 to 2024 here— is useful for all sorts of purposes, but its main drawback is that “top-coding” of high incomes means it misses the full scope of how much income is made at the very top, and so it blunts presentations of just how unequal the U.S. economy has become and why that matters for typical workers and their families. Figure B takes another tack, charting the growth of workers’ compensation (wages and benefits) for production-nonsupervisory workers in the private sector and net labor productivity between 1948 and 2024. We choose to display average compensation trends for production/nonsupervisory workers rather than all workers because this group, which makes up around 80% of the workforce, excludes well-paid managerial roles like corporate executives, who have seen astronomical pay increases in recent decades. In our view production/nonsupervisory workers represent the “typical worker” more faithfully than an overall average.
We use economy-wide labor productivity, inclusive of output from farms, government agencies and nonprofits, net of depreciation, in order to capture the potential growth in living standards for the entire economy. To ensure the growth of compensation and productivity is an apples-to-apples comparison, we use the same mixed-CPI series to deflate both measures, rather than a pay-specific one for compensation.1
Figure B
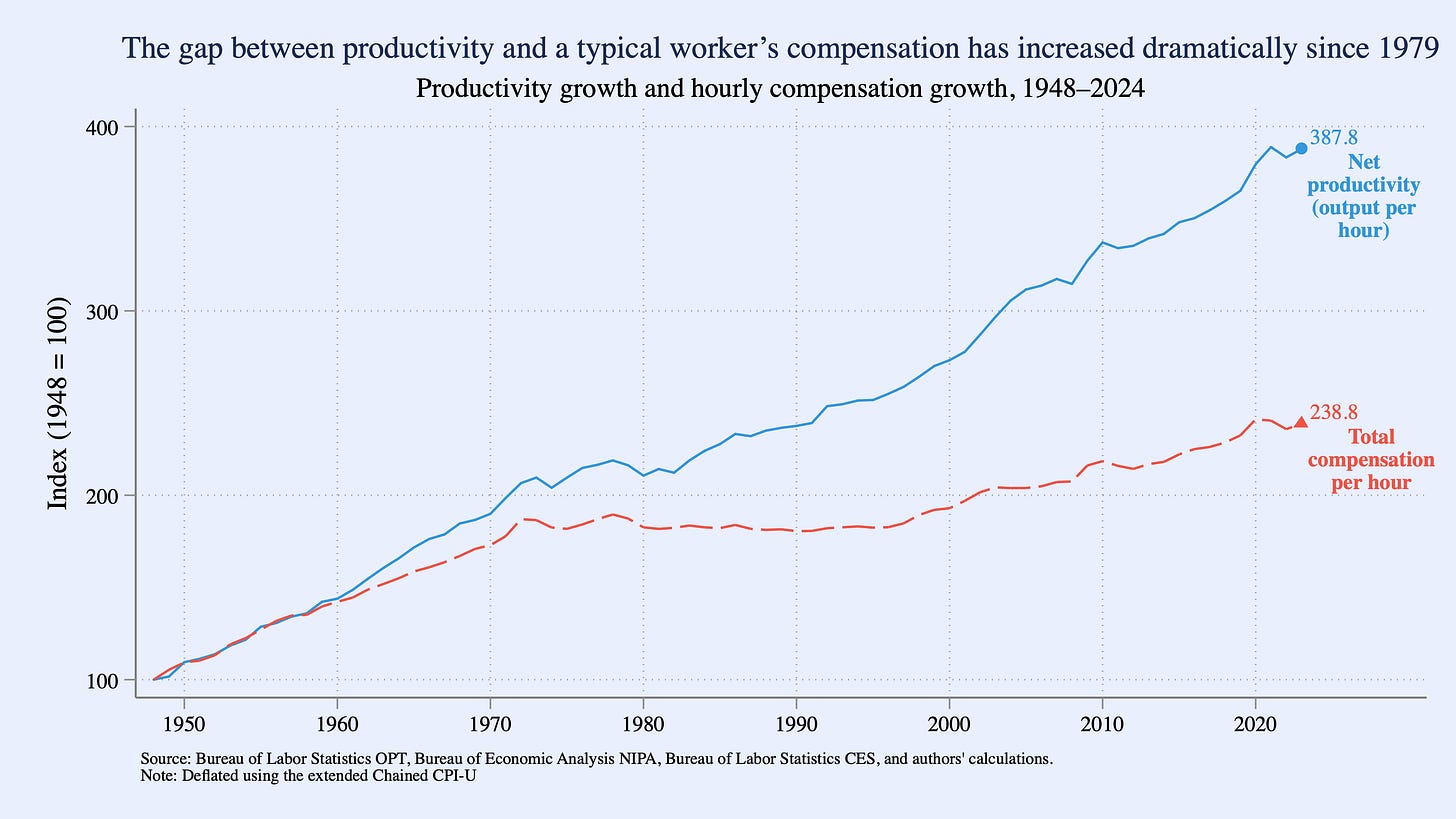
Between 1948 and the late 1970s, pay for the typical worker climbed together with productivity. However, since the late 1970s, workers have experienced a sharp divergence between the growth in their pay and that of labor productivity of the entire economy. In effect, a good share of the potential growth in compensation, as measured by productivity, ended up in pockets that were not the typical worker.
While there has been some criticism that using average compensation for all workers instead of compensation for production/nonsupervisory workers would better capture “economy-wide” compensation, in our view this misses the point. Incorporating the pay of managers and CEOS would lead to rising growth in compensation, likely close to on par with the growth in productivity, yet the fact that we see a wedge when they’re excluded shows that that growth was uneven, with managers, CEOs, and highly-privileged professional workers (think specialty doctors and corporate attorneys) taking the lion’s share of the potential pay generated by rising productivity.
It’s possible then, that voter dissatisfaction with the economy in 2024 was pent-up frustration that built while inequality rose for decades. Why this frustration boiled over and became seemingly decisive in 2024 is a question for others, but profound dissatisfaction with how the U.S. economy delivers for the vast majority would not have been unreasonable in 2024 or any other year since the late 1970s.
Who benefited from productivity growth if typical workers mostly didn’t?
A natural question that arises from these data is just where did the “excess” productivity go if not to the paychecks of typical workers? A significant portion of it went to higher corporate profits and increased income accruing to capital and business owners. But most of it went to those at the very top of the wage distribution. As shown in Figure C, earnings for those at the top grew much faster than the average of the bottom 90% of earners. In fact, when the very top 0.1% of the earnings distribution is on the graph, the bottom looks incredibly flat: growth for the bottom 90 percent was 44% over this period, but growth for the top 0.1% was 354%.2
Figure C
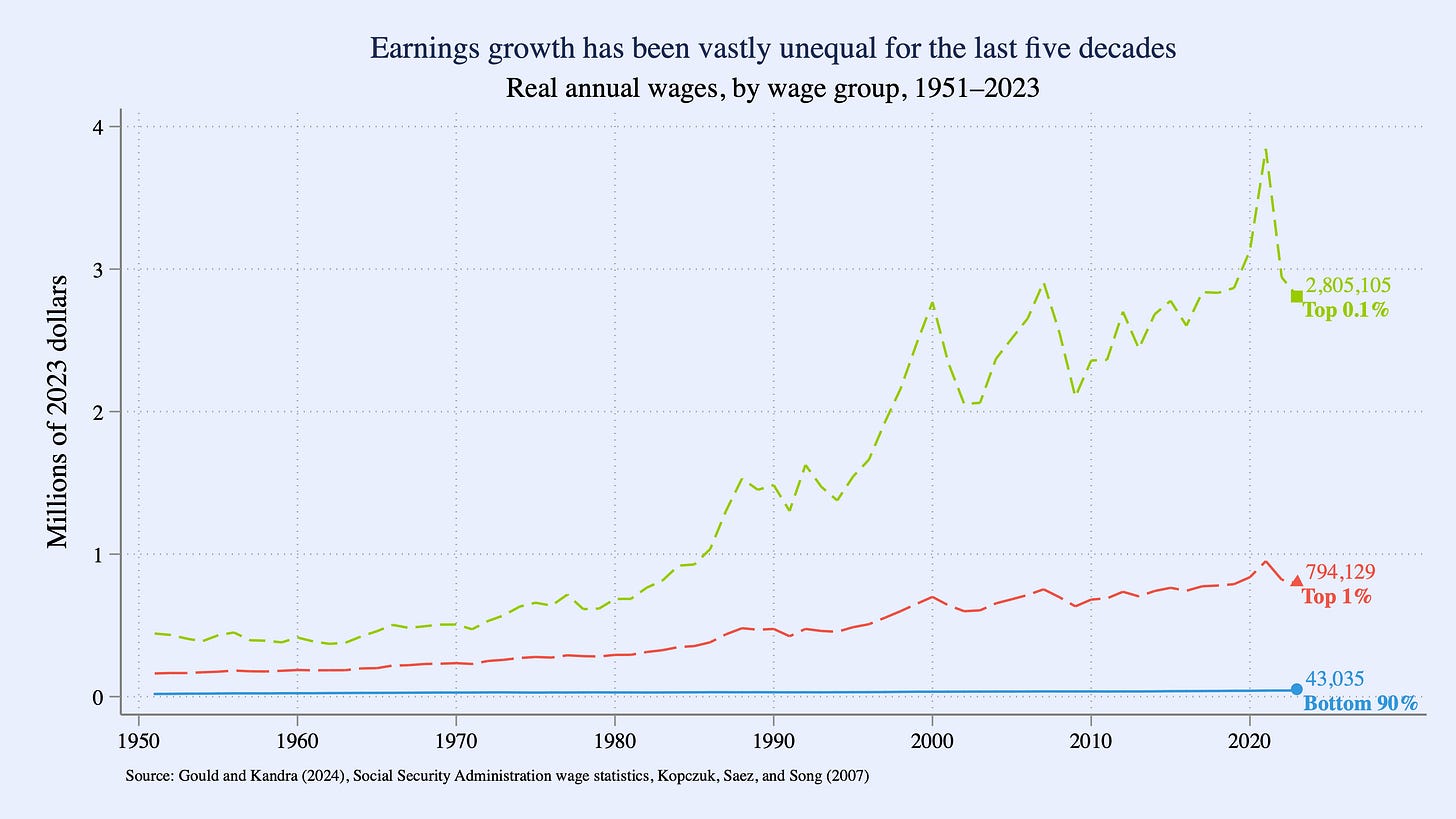
If one wants to know how the top 0.1% claimed so much wealth and income in recent decades, simply look at the growing wedge between the productivity and pay lines on the previous figure. If you think this stratospheric rise in inequality of wages and incomes is bad for the American economy and society more generally, then you need to figure out how to make those productivity and pay lines move closer together. Again, our new data tool can help think through some of this.
Inequality came from the labor market – what can be done about it?
Moving pay and productivity closer together will require a lot of policy changes – but they are all united by the common root that they aim to bolster the leverage and bargaining position of typical workers as they look to achieve higher wages.
The most obvious way workers have historically exercised bargaining power in the labor market is through formal collective bargaining undertaken by unions that represented them. But unionization rates in recent decades have plummeted, even as workers’ desires for representation have actually grown. Figure D below highlights this long-run decline in unionization, with its rise and falling mirroring the fall and rise of inequality.
Figure D
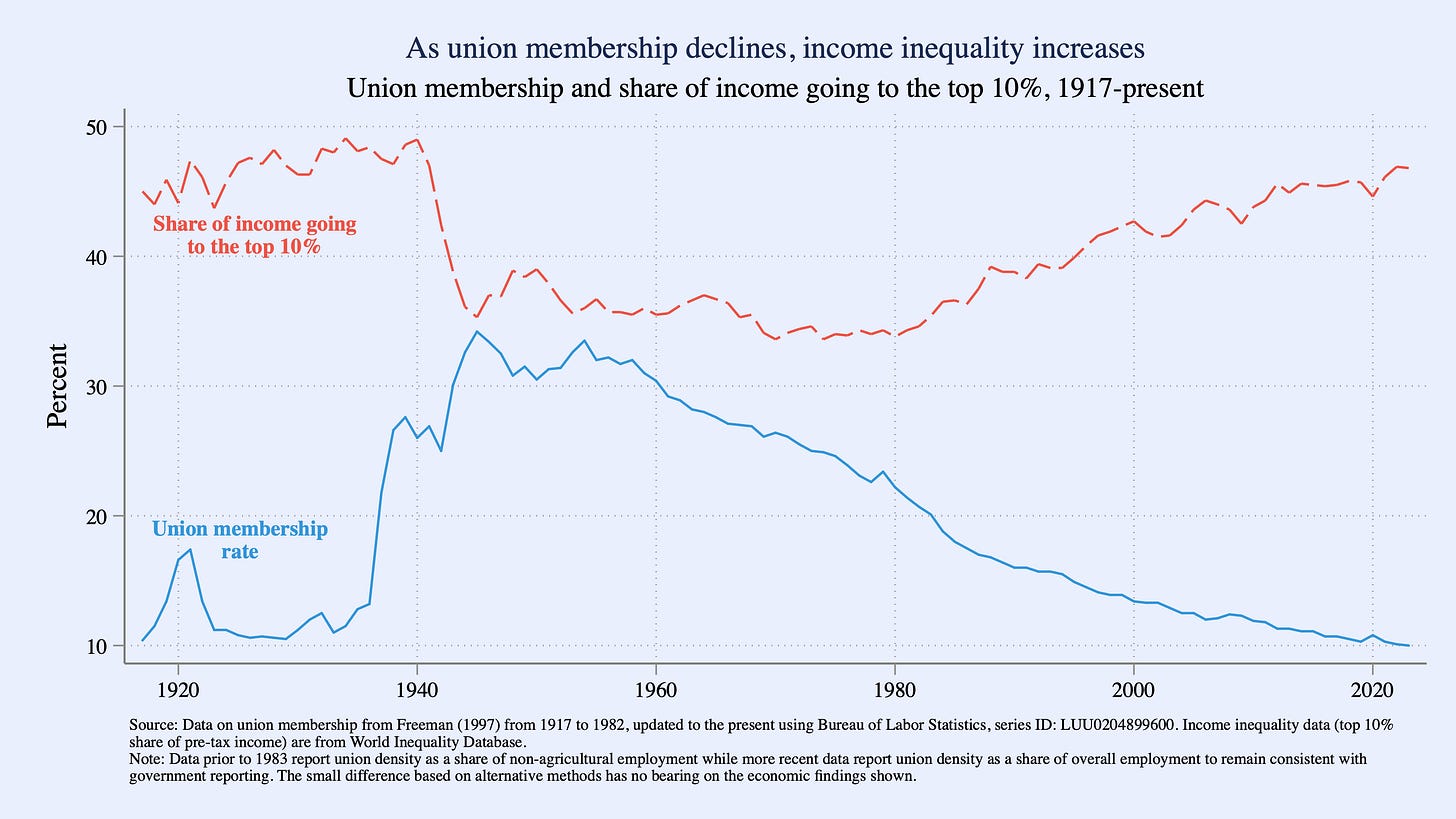
Unions directly raise the wages of union members and also indirectly increase the wages of non-union workers through spillover effects. Fortin Lemieux and Lloyd (2021) show that when union density is high, unions raise wages in both union and nonunion sectors; as a result, Mishel and Bivens (2021) estimate the erosion of unions over the 1979-2017 period explains more than one-third of the growth in the wage gap between the 50th and 90th male wage percentiles.
The wedge between the desire for unions and the availability of them is due to labor law failing to keep pace with growing employer hostility and willingness to stop union organizing efforts through any legal or illegal means available. Stansbury (2021) finds that labor law noncompliance penalties are so small that a “a typical firm may have an incentive to fire a worker illegally for union activities if this illegal firing would reduce the likelihood of unionization at the firm by as little as 0.15-2 percent.” Currently, the main agency responsible for enforcing labor law and collective bargaining is under attack, hampering the ability of unions to increase compensation and improve working conditions.
Besides unions, other key labor market institutions looking to buttress workers’ ability to see wage growth have also been eroded through intentional policy decisions – like the decision to not raise the Federal minimum wage since 2009, the longest stretch in history. Figure E below documents the steady erosion in the real value of the Federal minimum wage over the last 55 years. The inflation-adjusted value of the federal minimum wage is at its lowest point in nearly seven decades, and the main obstacles to raising it – Republican legislators – control Congress.
Figure E
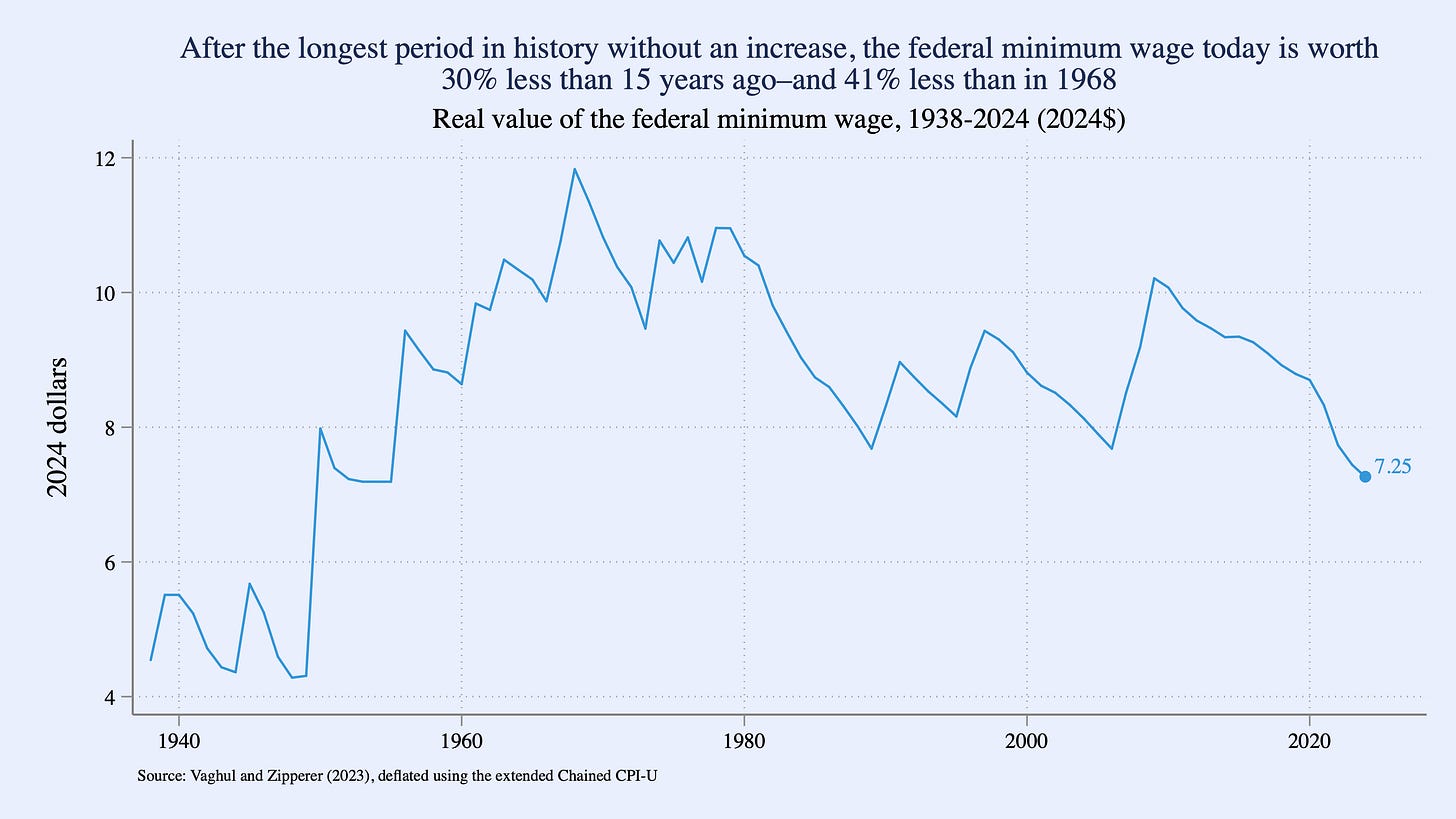
Minimum wage increases raise family incomes at the bottom of the wage distribution, and Derenoncourt and Montialoux (2020) and Wursten and Reich (2023) show that minimum wages have been an important tool to reduce racial wage gaps. Minimum wages that fail to keep pace with inflation reduce the wages of the lowest-paid workers and worsen inequality, particularly among women.
While minimum wages that protect pay for low-wage workers have eroded, policy changes have encouraged massive growth in pay at the top. For example, CEO pay has exploded in recent decades, even as each dollar paid to CEOs comes directly at the expense of corporate shareholders who are supposed to be the bosses of corporate managers. However, because the rules of corporate governance do not give shareholders any real power to rein in pay for managers, the upward ratchet has continued for decades. Figure F below shows that between 1978 and 2023 CEO pay ratio, defined as realized CEO compensation divided by average private-sector production and nonsupervisory wages, rose from 31.0 to 290.3, an increase of 836%.
Figure F
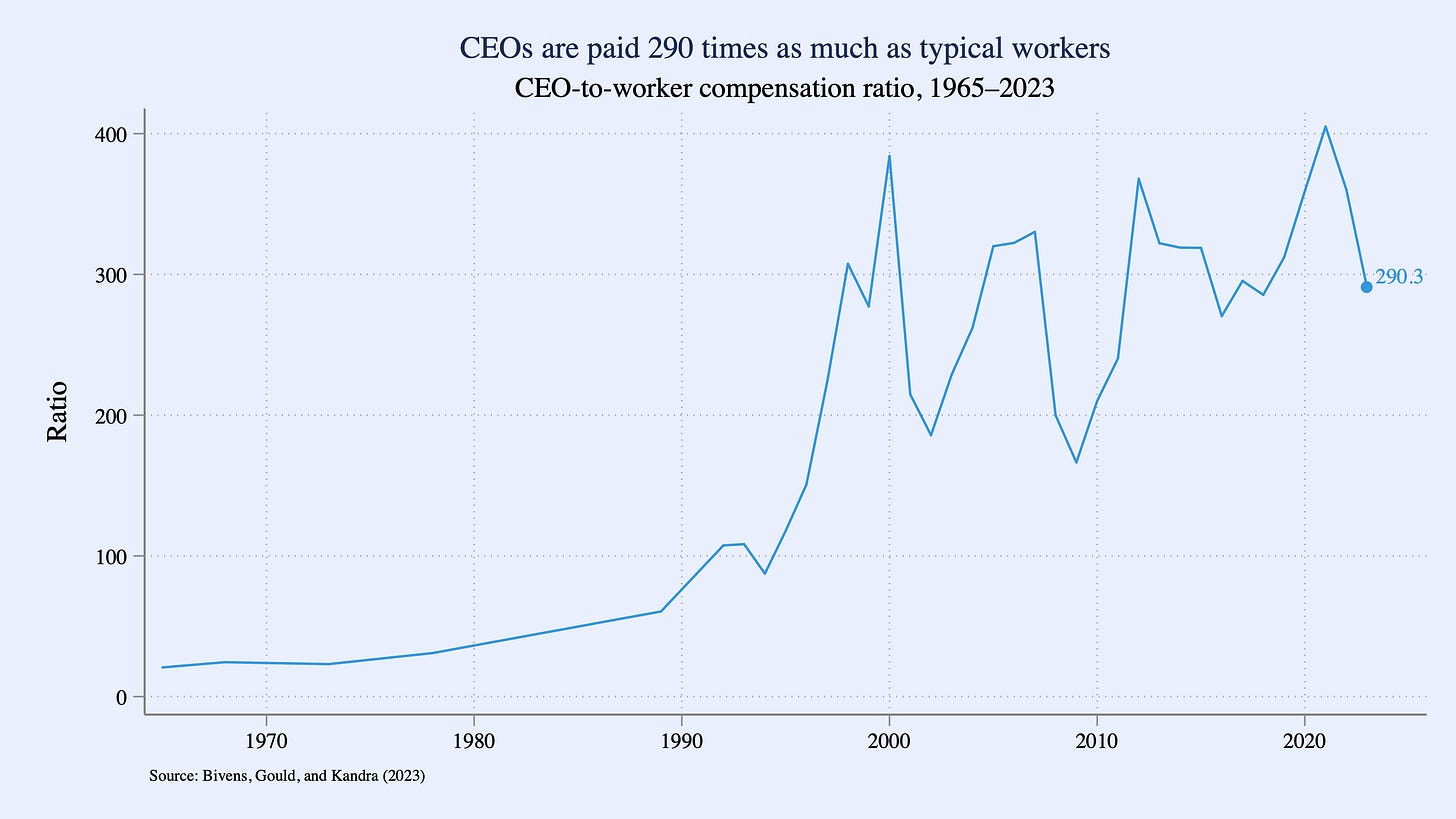
Piketty Saez and Stantcheva (2014) show that higher marginal tax rates on top incomes would reduce CEO and executive pay by reducing rent-seeking: with higher marginal tax rates, high earners would bargain less aggressively because the potential benefit of this rent-seeking (take-home income) would be reduced. In addition, worker representation on corporate boards and greater “say on pay” policies may limit executive compensation (Bivens Gould Kandra 2024). In the current political moment, at the same time as reducing incomes for most working Americans via SNAP and Medicaid cuts, Republicans are dead set on rewarding the most rich: reduced IRS audits and proposed tax cuts will significantly raise incomes for the top 1 percent.
Finally, centering the maintenance of full employment as the most-important goal of both fiscal and monetary policy would go a long way toward reversing the trend of too little wage growth for the vast majority of working people. The rapid wage growth between 2019 and 2024 for the lowest-paid workers was the likely outcome of keeping unemployment very low for an extended period of time and the expansion of unemployment benefits that supported more labor market competition, particularly among the lowest-paid workers. Tight labor markets like this increase job opportunities and pressure employers to improve working conditions in order to recruit and retain workers. As Autor, Dube, and McGrew (2024) show for the recent period, labor market tightness significantly raised wages in low-wage labor markets, compressing the overall wage distribution. Unfortunately, over much of the post-1979 period that saw inequality increase, labor markets were not tight and excessively high unemployment rates were tolerated for too long. Over this longer time horizon, had we maintained full employment more often, wages would be much higher today. For example, taking a back of the envelope estimate from Bivens and Zipperer (2018), a 1 percentage point lower unemployment rate would raise real annual median wage growth by roughly 0.4 percent, about double the actual annual real wage growth of the median wage over the 1973-2024 period. Instead of a median hourly wage of $24.75, the median wage today would be $30.50.
The path forward
Our view that the roots of rising inequality are in intentional policy decisions rather than in apolitical structural forces like technology is comforting from one perspective. Essentially, the disconnect between productivity and typical workers’ pay has mostly represented a zero-sum transfer from the bottom 80% of workers and towards capital-owners, corporate managers and highly-paid professionals. It can be reversed with policies that bolster typical workers’ bargaining power and leverage without moving the economy away from any efficient equilibrium.
But, just because the constraints on aggressively targeting a more equal distribution of labor market rewards are political rather than economic does not make it easier to achieve. There have been clear winners from the generations-long increase in inequality and they will not want to give up their winnings. These winners have extraordinary sway in the Trump administration, and policies seeking to help typical workers gain income at the expense of capital-owners and corporate managers are highly unlikely to be pursued. Even the huge potential gains from maintaining full employment look in peril, even with the administration inheriting a strong economy but pursuing a deeply chaotic policy agenda that has spiked uncertainty and created loud rumblings of a rapid slowdown in growth.
States can do a lot of easy work in maintaining strong minimum wages for the bottom of the workforce - and many already have. States could also resist efforts to expand “right to work” laws that make union organizing near-impossible, and could even look to reverse these laws (or others that impede organizing). They can also lead in enforcing key labor protections like barring non-compete agreements, which have been a surprisingly strong drain on typical workers’ bargaining power.
Finally, we would just note that a policy regime change that bolstered typical workers’ ability to gain in labor markets would be highly desirable to pair with any changes to reduce our long-run fiscal gaps. Some of these long-run fiscal gaps should be addressed with highly-progressive taxes on the very rich, but broader-based revenue sources might be needed to maintain or expand current income support, social insurance and public investments, and these broader-based revenue increases would be much more easily absorbed by a workforce seeing steady real wage gains year after year. Obviously none of this is in the immediate cards, but it’s worth working towards.
We use the same deflator for both measures that the Census uses for its historical income series: the chained CPI-U back to 2000, the CPI-U-RS from 1978 to 1999, the CPIU-X1 from 1967 to 1977, and the CPI-U for earlier years. Earlier iterations of this graph used an employer-provided health benefit deflater in its compensation estimate to reflect the fact that prices in health care rose much faster than workers’ pay, however it made the comparison of the two estimates less intuitive. Using the same deflator for both series allows us to isolate only the effect of rising inequality in suppressing pay growth.
It’s important to note that the pay of CEOs is classified as wage income in these data (exercised stock options, for example, are labor earnings).


