Cutting Medicaid Is A Risky Move for Republicans
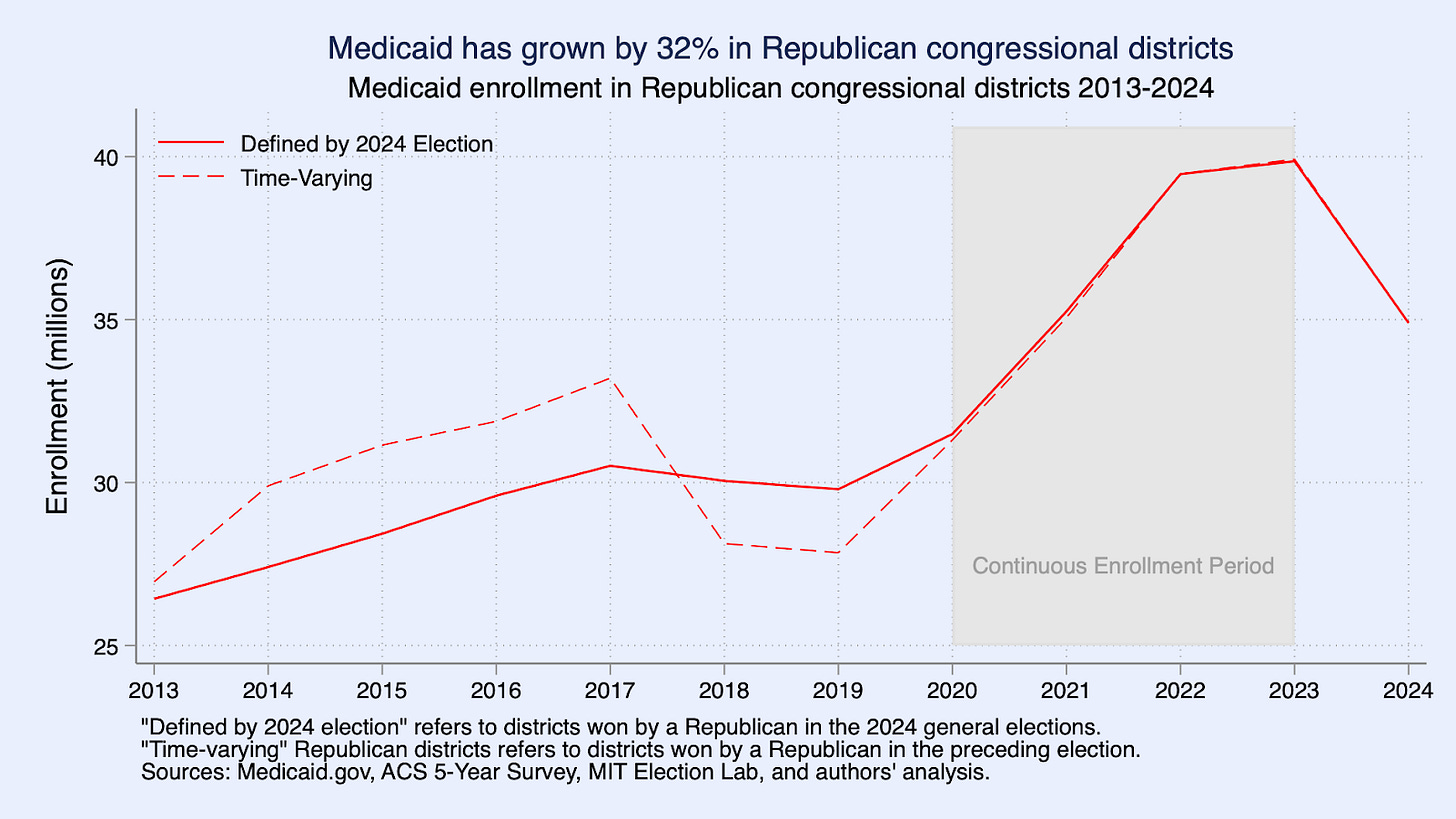
Medicaid has grown by 8.46 million or 32% in Red Districts Since 2013
The Republican budget proposal, as broadly understood, would cut Medicaid spending this decade by up to $880 billion. Medicaid was once associated with Democratic constituencies—blue states, urban areas, and women. But today, many Republican Congressional districts are heavily exposed to Medicaid and its politics, both because of eligibility expansions in Republican districts put in motion by the Affordable Care Act (ACA) and because working-class voters have migrated to the Republican party. Here, we trace the political geography of Medicaid over the past decade and its implications for the politics of a 2025 TCJA extension deal. Medicaid enrollment has grown by 8.46 million people, or 32%, from 2013 to 2024. This growth has been the fastest in frontline districts, where Republicans face the closest races in 2026, and in rural, poor, and white districts. Republican members now face a vexing choice between prioritizing large tax cuts to high earners and corporations and protecting Medicaid coverage for their own constituents.
Medicaid has boomed in Republican congressional districts
To quantify how Medicaid enrollment has climbed in Republican districts, we estimate Medicaid enrollees in each congressional district using data from the American Community Survey (ACS) and Medicaid.gov, following the methodology of the Center on Budget and Policy Priorities (CBPP). This approach aggregates ACS data by Census tract to the congressional district, scaling up the estimates for undercounting in ACS data to match administrative enrollment data from the Centers for Medicare and Medicaid Services. Our tallies include Medicaid and CHIP, the Children’s Health Insurance Program (henceforth, Medicaid). See the appendix for details.
Medicaid enrollment in Republican congressional districts has increased by 8.46 million or 32% between 2013 and 2024, and the share of the population with Medicaid coverage in these districts has risen from 18.1% to 21.7%. The cumulative change is virtually identical if we define Republican districts based on the outcome of the 2024 elections or if we allow the definition to vary over time. Most of the growth came from increased enrollment of adults (55% of total growth) and children (33%), with seniors and other groups accounting for the remainder (see appendix).
Medicaid coverage grew somewhat faster in districts controlled by Democrats (39.6%) than in districts controlled by Republicans (32.02%). However, it is not clear that this fact changes the politics. For Republican voters in South Dakota or Ohio who stand to lose coverage, it is cold comfort to know that Democratic voters would lose coverage as well.
The growth in Republican congressional districts reflects the state-level Medicaid expansions under the Affordable Care Act. Since 2014, 41 states (including DC) have expanded Medicaid to nearly all adults with incomes below 138% of the Federal Poverty Line ($21,597 for an individual). Growth accelerated in 2021, with a number of states with Republican majority delegations expanding Medicaid (Oklahoma, Missouri, South Dakota, and North Carolina). Today, expansion states cover 134 out of 220 Republican-held congressional districts. The bump in enrollment starting in 2020 reflects a temporary policy that allowed Medicaid enrollees to be continuously enrolled without the typical renewal process, which was unwound starting in 2023.1 In the Appendix, we report enrollment growth separately for each congressional district in the country.
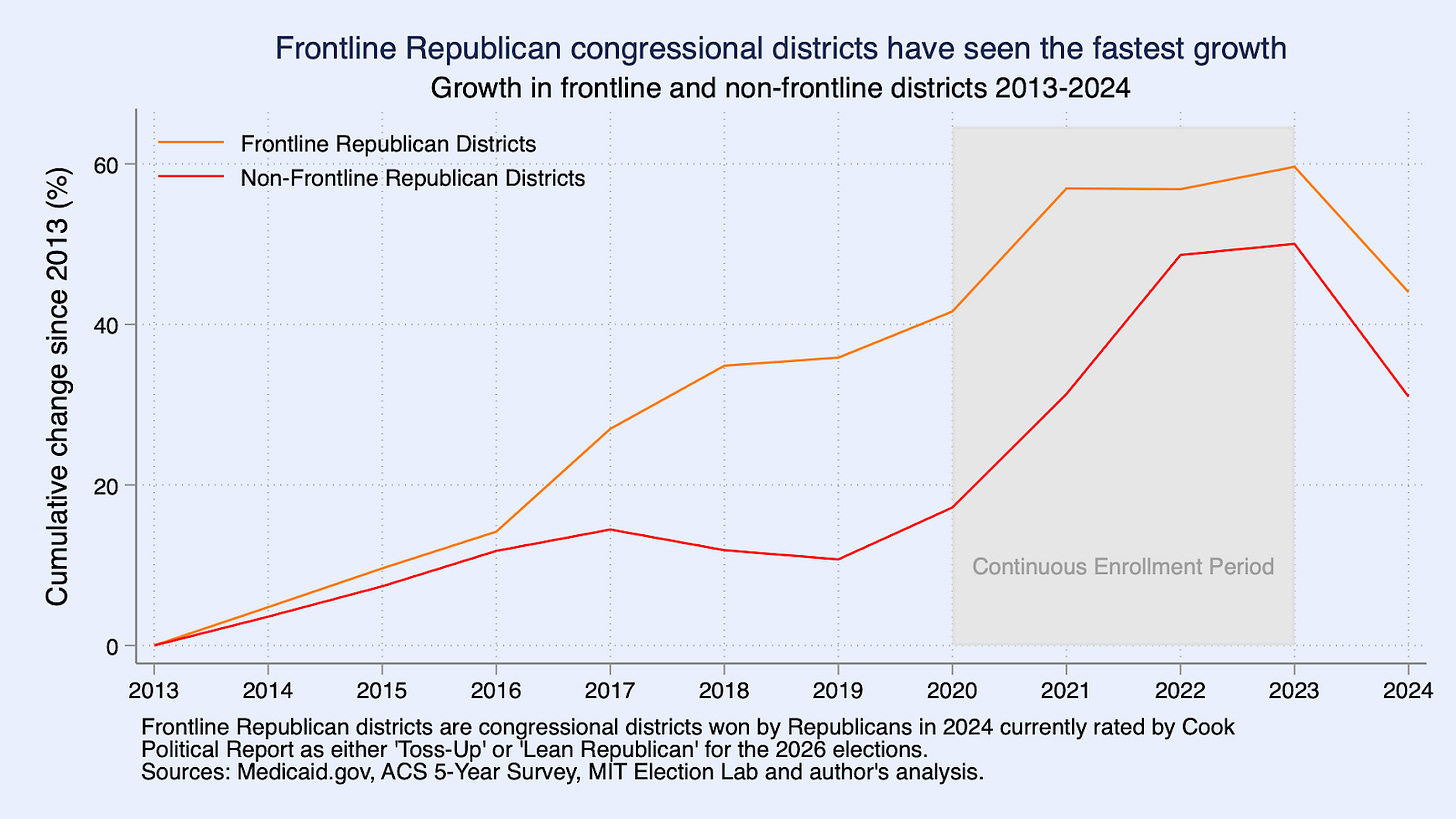
Frontline Republican congressional districts have seen the fastest growth
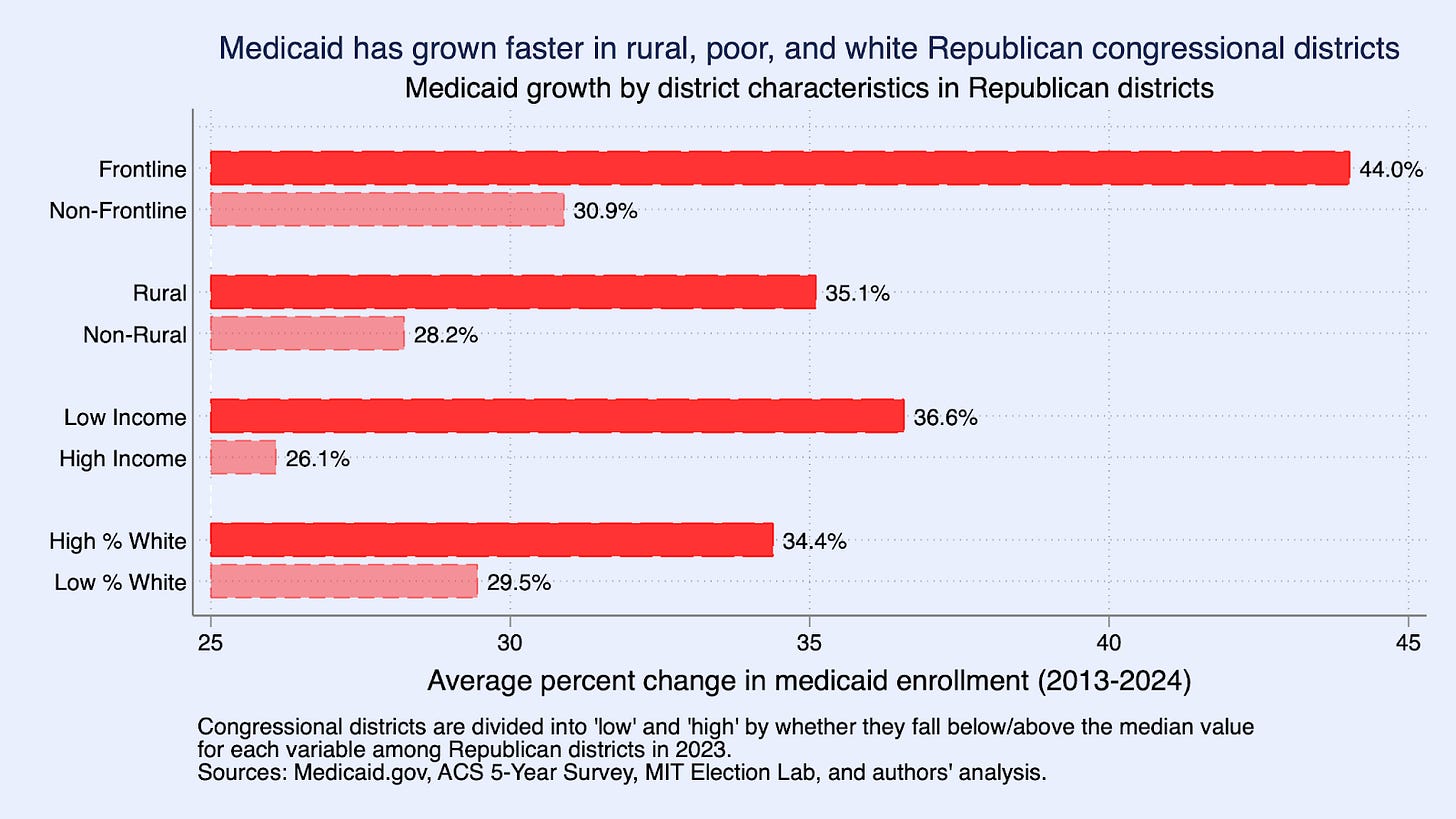
Medicaid’s increasing relevance for Republican political districts is only magnified when examining “frontline” Republican seats, defined as the 17 Republican-controlled districts that the Cook Political Report classifies as “Toss-Up” or “Lean Republican” in their 2026 House Race Ratings.2 Over 2013-2024, Medicaid enrollment has grown 44% in these frontline districts versus 31% in non-frontline districts held by Republicans.
These frontline Republican seats include both Republican-controlled congressional districts in states with Democratic-controlled state governments like California's 22nd, 40th, 41st and New York’s 17th districts; Republican districts in Republican states, including in Iowa and Nebraska; and Republican districts in swing states, including Pennsylvania, Wisconsin, Arizona, Virginia, and Michigan.
To further characterize changes in Medicaid enrollment, we split Republican congressional districts by whether they are above or below the median on several dimensions and calculate Medicaid growth for these different groups. Medicaid grew faster in more rural Republican congressional districts. It also grew more rapidly in districts with lower average incomes and in districts with a larger white (non-Hispanic) population share. This analysis underscores the rising importance of Medicaid in rural, poor, and predominantly white Republican-held regions of the country.
Medicaid coverage strengthens finances, improves healthcare access, and saves lives
Medicaid offers perhaps the best bargain in U.S. healthcare, keeping costs low in large part because the program typically pays the lowest reimbursement rates to providers. Even so, the program is often considered key to maintaining the fiscal solvency of rural hospitals. Beyond its immediate provision of healthcare and financial risk protection to beneficiaries, studies have found consistent evidence of beneficial longer-run impacts, including reduced adult mortality and disability, increased employment and income, and even lower rates of later-life incarceration for Medicaid beneficiaries enrolled during childhood. As a matter of spending efficiency, an analysis by CBO economists indicates that about half of early-life spending on Medicaid is later recouped to the federal government in the form of greater tax revenues and lower transfer payments by the federal government.
Republican representatives face a vexing choice
The Republican budget calls on the House Energy & Commerce Committee to cut spending by $880 billion over a ten-year window. There is no realistic path to achieving those cuts that does not go through Medicaid. Whereas a decade ago, a vote to cut Medicaid might have been easier for Republicans to make, today’s Republican party has made gains among constituencies that rely on Medicaid, and Medicaid has expanded into redder states and redder congressional districts. That leaves Republicans—and especially frontline Republicans facing close 2026 elections—facing the prospect of cutting healthcare for their own constituents in order to pass tax cuts targeting the rich and corporations. Even in an era of high partisan polarization, it is hard to imagine constituents not noticing.
Methodology
We estimate congressional district-level Medicaid enrollment following the methodology of the Center on Budget and Policy Priorities (CBPP). We start with Medicaid and CHIP enrollment data at the Census tract level from the American Community Survey (ACS) and aggregate it to the congressional district level using Geocorr (2018 and 2022).3 To correct for underreporting of Medicaid enrollment in the ACS, we scale these estimates using data from Medicaid.gov’s Transformed Medicaid Statistical Information System (T-MSIS) Analytic Files (TAF). For each year from 2017 to 2023, we scale the ACS congressional district level estimates by the ratio of the state-level enrollment in the Medicaid.gov data and state-level enrollment in the ACS. For 2024, where we do not have ACS data, we scale the 2023 ACS congressional district values by the ratio of the state-level 2024 Medicaid.gov and 2023 state-level ACS data. For 2013-2016, where we do not have Medicaid.gov data, we scale the congressional district level ACS data by 1.15, which is the average ratio of the state-level Medicaid.gov and state-level ACS from the pre-COVID-19 2017-2020 period. The assumption underlying this approach is that the underreporting in the ACS is roughly constant across congressional districts within each state. We use the 2023 ACS to measure congressional district demographic characteristics, aggregating up from the Census tract level using Geocorr as before. We obtained all House election data from the MIT Election Lab.
The time trend, including the post-2023 unwinding, is similar in Democratic districts. The similar growth rates observed when districts are defined by party control in 2024 versus allowed to dynamically vary suggests that the key changes underlying Medicaid’s increased takeup in Republican districts have been Republican-majority states’ adoption of the ACA Medicaid expansion and, from 2020 to 2023, the national continuous enrollment policy.
Because Colorado’s 8th district did not exist prior to redistricting in 2022, we drop it from our analysis of frontline districts.
Our approach allows the Census tracts that comprise a congressional district to change over time. Congressional districts that were eliminated are included in the analysis with time-varying districts but excluded when we define districts based on the 2024 elections.


