Asymmetric amplification and the consumer sentiment gap
How excess Republican partisanship contributes to the gap between economic fundamentals and consumer views on the economy
A puzzling feature of the current economy is the mismatch between strong economic fundamentals – low unemployment, easing inflation, and strong GDP growth – and gloomy consumer sentiment. In this post, we provide one contributing factor, which we refer to as asymmetric amplification: While both Republicans and Democrats view the economy more favorably when their party controls the White House, the magnitude of this partisan bias is roughly two and a half times larger for Republicans than for Democrats. Adjusting for differences in the degree of partisanship closes 30 percent of the gap between predicted and observed economic sentiment, while still leaving a meaningful portion of the gap unexplained.
Consumer sentiment has diverged from fundamentals since 2020
The University of Michigan’s Index of Consumer Sentiment is a widely cited barometer of consumers’ economic views.1 Each month, surveyors ask a nationally representative sample of approximately 600 Americans a range of questions about the economy. The Index of Consumer Sentiment is based on the responses to five questions, covering current and expected economic conditions for the respondent’s family and the country as a whole. These responses are quantified and aggregated to create an index, with higher values indicating more positive sentiment.2
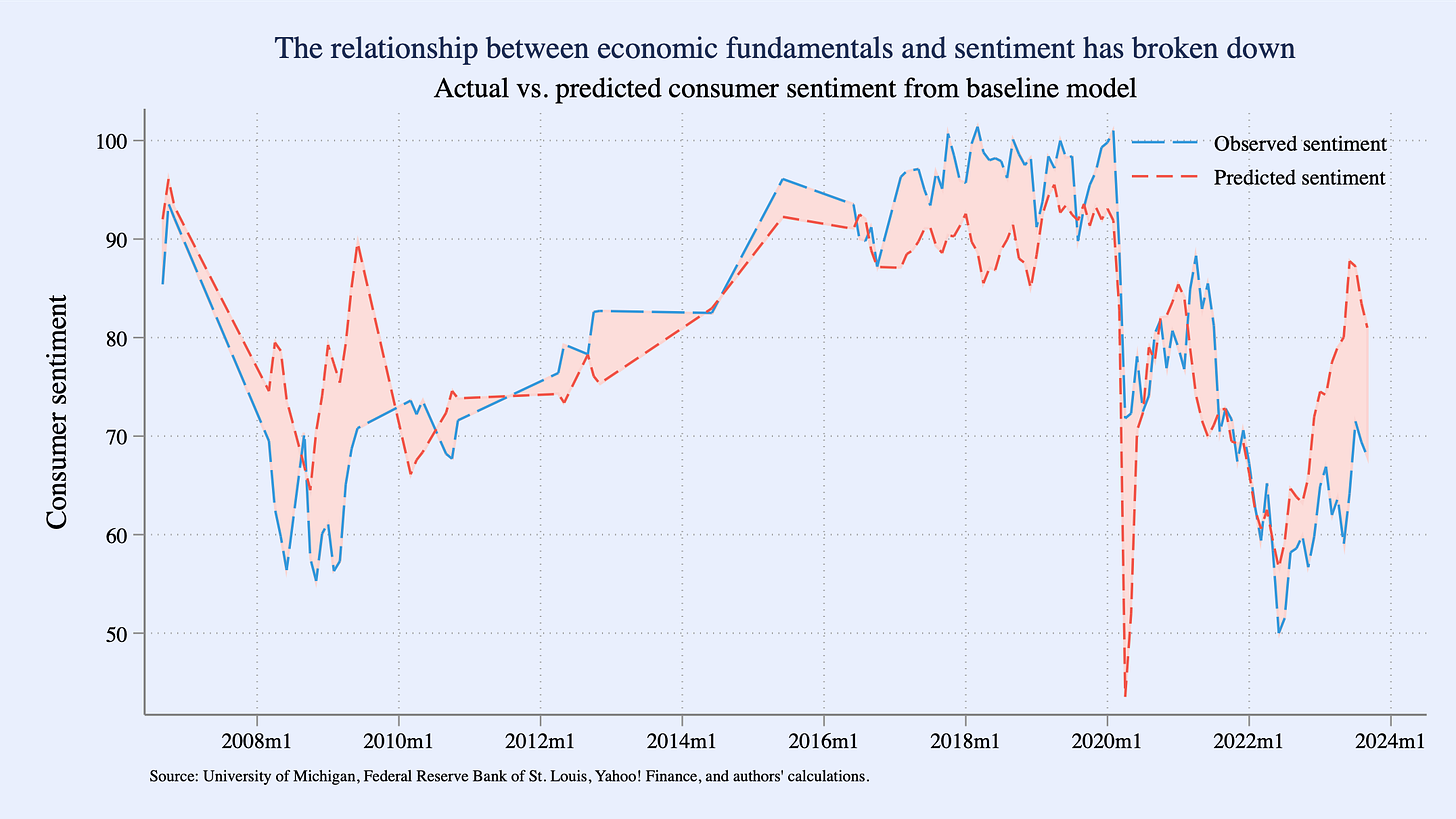
In recent months, the index has been stuck in the 60s—a range it last consistently occupied during the global financial crisis. Statistical models that aim to predict consumer sentiment with economic fundamentals performed relatively well before the pandemic. But since 2020, these models have broken down. As the figure below shows, a simple model that uses the inflation rate, unemployment rate, quarterly stock market returns, and consumption predicts that consumer sentiment should be roughly 13 points higher than the observed value. Analysis by The Economist shows an even starker gap. (Data and code to reproduce all of the analysis in this post are available here.)
Republican sentiment is more sensitive to politics
In addition to providing an aggregate index of consumer sentiment, the University of Michigan also provides sentiment indices by party affiliation. That is, it reports subindices for how Democrats, Republicans, and Independents feel about the economy (the overall measure is a weighted average of these subindices).
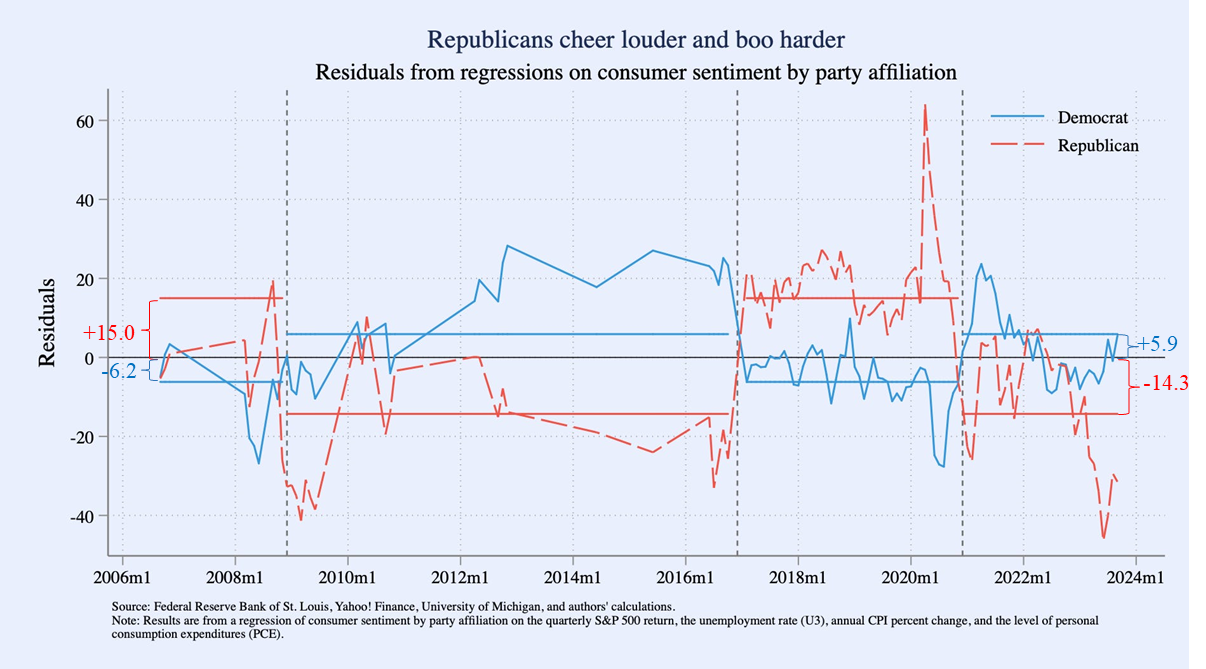
In the graph below, we plot the differences between consumer sentiment predicted using our basic model and what Democrats and Republicans actually report (economists call these differences “residuals”). When the residual is zero, the model’s prediction of consumer sentiment perfectly matches what was observed; when it is positive, Democrats or Republicans are more buoyant about the state of the economy than the model’s predictions (and vice versa when it is negative). The graph also has three vertical lines that show when control of the White House changed party.
The figure shows the well-known pattern of partisanship in consumer sentiment.3 When a Republican president is in power, Republicans are more jubilant about the economy than predicted (i.e., the residuals are positive) and Democrats are more gloomy (i.e., the residuals are negative). When a Democrat is President, these dynamics are reversed; Democrats feel better and Republicans feel worse than predicted based on economic fundamentals.
However, while respondents of both parties exhibit partisan bias, the magnitude of their bias is not the same. When a Republican is in the White House, Republican survey respondents feel about 15 index points better than predicted about the economy, whereas Democrats feel around 6 index points worse. When a Democrat is President, Republicans feel about 15 index points worse than the economy, but Democrats only feel around 6 index points better.
This roughly +/- 15 point swing for Republicans versus the +/- 6 point swing for Democrats is what we term asymmetric amplification. (Independents’ views are roughly halfway between those of Republicans and Democrats.)
The results above relied on our basic model that predicted consumer sentiment with the inflation rate, unemployment rate, quarterly stock market returns, and consumption. To probe sensitivity to these modeling choices, we experimented with two alternative models.4 While the precise estimates vary, the table below shows that the general takeaway is robust.
Adjusting for asymmetric amplification shrinks the gap, but adjusted sentiment is still low
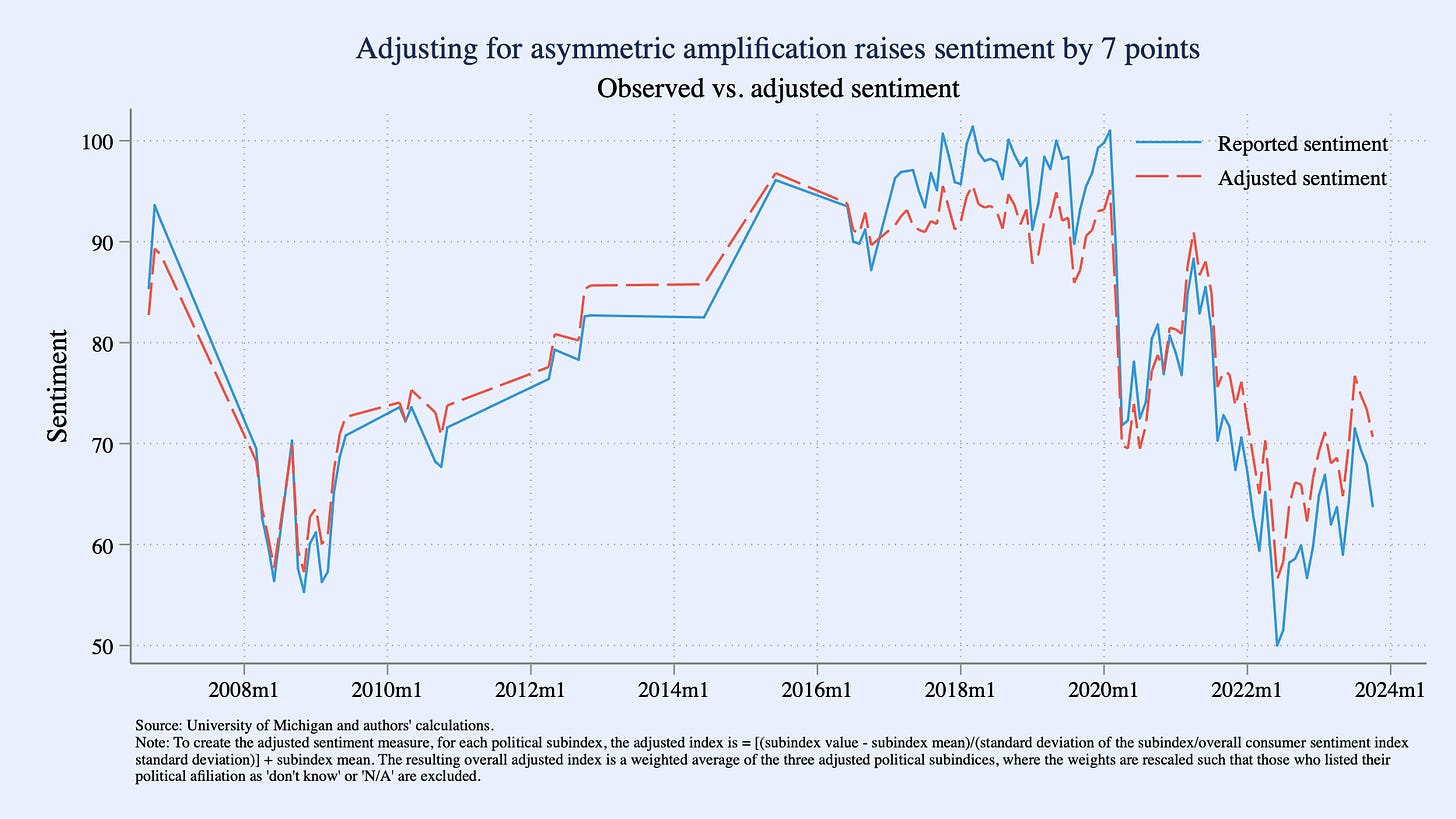
To what extent can this asymmetry in partisan bias explain the gloomy economic sentiment we observe today? We take the subindices of consumer sentiment by party affiliation and standardize the degree of partisan bias, such that Republicans and Democrats exhibit equal and opposite swings in sentiment when control of the White House changes power. We then combine these adjusted subindices into an adjusted consumer sentiment index.
We find that adjusting for asymmetric amplification shrinks the current gap between observed and predicted consumer sentiment by 30 percent. By the same token, the adjustment raises current consumer sentiment to 71, or about 7 points higher than the unadjusted index value of 64 (see figure). Still, adjusted consumer sentiment of 71 is low, similar to values in the aftermath of the global financial crisis.
Conclusion
Our findings can be summarized by analogy: We find that Republicans cheer louder when their party is in control and boo louder when their party is out of control and that adjusting the decibel level so that Republicans and Democrats cheer with equal volume explains 30 percent of the current gap between observed consumer sentiment and what you would predict using economic fundamentals.
There are many potential explanations for the current sour economic sentiment, and our explanation leaves ample room for other forces. Some have argued that increased social media usage, combined with social media’s penchant for amplifying bad news, may be dragging down views of the economy. Others have suggested that negative consumer sentiment reflects consumers’ outsized concern about inflation in the current environment. Still, others have proposed an explanation in which downbeat survey responses on the economy are a form of “referred pain” from broader concerns over domestic and geopolitical events.
There is also the potential for other forces to operate through the channel we highlight. For instance, differences in the intensity of partisanship in media viewed by Republican versus Democratic survey respondents could be contributing to the asymmetric amplification we document.
Markets and forecasters have historically interpreted consumer sentiment as a leading indicator of economic activity. Whether partisanship has diminished the information content of these measures, and whether adjustments like the one we propose can improve its forecasting value, would be interesting questions to explore.
The Conference Board’s Consumer Confidence Index is also closely watched but does not break down responses by party affiliation.
Responses are converted into net favorability subindices (percent favorable minus percent unfavorable plus 100) and averaged together, with some additional minor adjustments. As such, a point increase in the index can be interpreted as a 1 percentage point increase in average net favorability. See here.
There is a large literature in political science documenting how Democrats and Republicans hold different beliefs about objective facts, such as the unemployment rate. See Bullock and Lenz (2019) for a review.
The first alternative model predicts consumer sentiment using the prices of two salient goods—food and gasoline—along with wages and a measure of employment (EPOP). The second alternative model, which is designed to be as parsimonious as possible, predicts consumer sentiment using only the rates of inflation and unemployment.


Really interesting research.
It looks like the residuals may be associated with stock and bond market returns. Is that in your model? I would also be curious about the effects of mortgage rates and home prices -- the usefulness of the "home equity ATM" effect that we know influences consumer spending. Are these factors included in your sentiment model? It also seems possible that these factors would affect Republicans and Democrats differently, although unlikely to change your conclusions.
Have you ever come across Michael Niemira's 1992 Public Perspective article arguing that Michigan consumer confidence index (CCI) in October is a good predictor of November presidential elections? 7 out of 9 correct predictions from 1956 through 1992 according to Niemira's simple model; incumbent party's share of popular vote = -20% + (0.79 x UofM October CCI)%. Model based on 9 observations not likely to be very useful. I doubt that Niemira's finding still holds up with 1996 to 2020 elections factored in. And, I don't know whether UofM CCI results can be read as consistent series from 1956 to today. I have heard pundits close to my advanced age tout UofM consumer confidence as an election predictor. Probably another case of Keynes' dictum: “Practical men who believe themselves to be quite exempt from any intellectual influence, are usually the slaves of some defunct economist."